Thursday, April 30, 2020

Badlapur PWS Weather summary for April 2020 

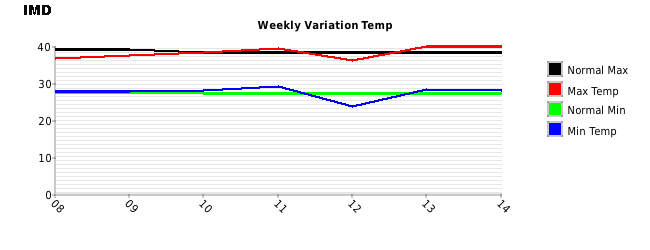
Highest Tmax 42.6℃ on 14 Apr

Lowest Tmax 35.4℃ on 8 Apr

Highest Tmin 26.9℃ on 19 Apr

Lowest Tmin 20.3℃ on 9 Apr

Avg Tmax 38.5℃
Avg Tmin 24℃
Mean Tavg 31.25°C

Tmax > 40°C = 8 Days
Tmax > 35°C = 22 Days
Tmax < 35°C = 0

Tmin > 24°C = 17 Days
Tmin < 22°C = 5 Days
Tmin < 20℃ = 0

Max Humidity Avg 84%
Min Humidity Avg 32%


Karjat AWS Weather summary for April 2020 


Highest Tmax 44℃ on 14 Apr

Lowest Tmax 37.4℃ on 8 Apr

Highest Tmin 27℃ on 29 Apr

Lowest Tmin 18.9℃ on 9 Apr

Avg Tmax 40.1
Avg Tmin 23.5℃
Mean Tavg 31.8

Tmax > 40℃ = 21 Days
Tmax > 35°C = 9 Days
Tmax < 35°C = 0

Tmin > 24°C = 16 Days
Tmin < 22°C = 8 Days
Tmin < 20℃ = 1 Day

Rainfall 2 mm on 11 Apr
Posted 30th April Thursday Afternoon:

The Phase & amplitude of MJO  becomes favourable for Cyclogenesis over the Bay.
The Genesis Potential Parameter (GPP) based on IMD GFS is indicating potential zone for cyclogenesis over south Andaman Sea .
Due to the above reasons, the Westerly wind force at 3N-5N along the Sri Lanka coast towards the Andaman Sea will gain strength in the next 2 days.

Today Westerlies are not strong enough to feed the upcoming BB-1


BB-1 will hence form around 1st or 2nd May.
Will take momentum slowly and strengthen to depression in next 3/4 days (4th/6th May) and initially track N/NW.


Can Meteorologists Help Epidemiologists with Coronavirus? See World Weather News

Wednesday, April 29, 2020

Posted 29th April Afternoon:

BB-1: 
The UAC over the Straight of Malacca at present will track W/NW into the South Andaman Sea. Will descent to form the Low Pressure BB-1 around 30th/1st May.
System showing several undefined and variable parameters as of now. 
Wind shear is strong in the North Bay, but favourable in south Bay, and the Equatorial and Sub Tropical flows consistency are to be observed. The propagation  of a Rossby Wave ( Trough) in the Eastern segment is favourable. The MJO entering phase 4 is also favourable.

The upcoming Western Disturbance may not effect the formation, but the track is to be seen.
SST will help gauge the "in situ" strength of the system once it travels Northwards (Or North/West wards). SST is warm enough now.

Tuesday, April 28, 2020

28 April 2020..
MAHARASHTRA .. Today's weather..

Eastern Vidarbha , the hot bed region is experiencing below normal temps by upto 6 c this time of the year ..

Nagpur was milder than Pune and Nasik !!
This can be attributed to the thunderstorm (Ts) activity over the region .
After a lull of few days, Interior North Kokan (Karjat) was hottest region of the state and country.
In the next 2 days,temperatures will increase over Vidarbha region as Ts activity reduces.
Scattered Ts activity over interior Kokan ,Madhya Maharashtra (adjoining the ghats), Marathwada is expected during the next 3 days.

Max temp in c today ..

Min temp 

Min temp was below normal over Vidarbha , south Kokan Goa (Vengurla) ,south Madhya Maharashtra (Kolhapur).
Min temp was above normal over Marathwada (Sambhajinagar).
Min temps will gradually increase over the state .

Min Temp in c today ..

Monday, April 27, 2020

Posted Monday Afternoon:

The Low Pressure, BB-1, is likely to form in the Bay around south Andaman around 30th April. should intensify in the next few days and travel N/NW from 30th -3rd May.

Rains to continue in the states of Odisha, Chattisgarh and W.Bengal initially on 27th, and then restricted to West Bengal.
Kolkata should get Thunder showers on Monday/Tuesday and Wednesday. 
Jabalpur may get light rains on 30th/1st May.

Delhi NCR days to get hot from 1st May, and can touch 41/42c.

For next 4 days Monday 27th-1st May:
Mumbai will be hot at 34/35c and very humid. Sweaty conditions , but be safe at home !
Chances of some clouds drifting from East and bringing some rains ( Lightning) over parts of Mumbai on 30th April/1st May.
Interior parts of North Konkan can get thunder showers on 29th-1st May.

Pune : Hot in the day and just pleasant at night at 21/22c. But getting cloudy with chances of rain in parts of Pune on 30th/1st May.


Sunday, April 26, 2020

Friday, April 24, 2020

Monsoon Watch (MW) - 2... 2020...24th April 2020

These reports are the views, study and observations of Vagaries. Estimates and forecasts are also the calculation of Vagaries, and may/may not tally with any other estimates/nodels. This may not be used for commercial purposes. Vagaries of Weather is not responsible for any commercial loss from this article, or these series of articles.


The Monsoon developments, as they unfold, will be analysed , discussed and explained in Vagaries. 

Vagaries follows the developments(parameters) that emerge during the summer (Apr/May) which lead to the monsoon.
 Vagaries believes the expertise to predict the monsoon in it's entirety during early summer itself (early April) is not feasable. The parameters themselves develop in April and May.Quantum of rain forecasting in April for June right through September is an impossible task. Things get clearer by last week of April. Vagaries' (in MW) normally remains true to estimates around early May. 
😎Otherwise the charm of chasing the monsoon parameters as they unfold during the summer , is lost.

As of 24th April, the South West Monsoon is just about 21 days away from its normal date of arrival from the shores of India ! Yes ! it's just 21 days from the First touch of shores...Southern most point of India on the South Andaman Islands, Indira Point, where the normal arrival date is 15th May.


Further Analysis of the parameters as discussed in MW-1... 


In this initial stage, we will observe the basic root and foundation, the initial 5 parameters only, and the initial seed of the monsoon. From these parameters, later a few more develop.


1. Cross Equatorial Winds from Southern Hemisphere and Mascarene high.
2. Pre monsoon showers / LWD.

3. Seasonal low over Indian subcontinent.
4. ENSO Status.
5. April synoptic features.

Situation as on 23rd April 2020


1. Cross Equatorial Winds and Mascarene high :


                           --Wind flow chart of 23 April 2020--


i)The cross equatorial wind flow, has deteriorated compared to MW-1 in the Western sector Southern Indian Ocean. SE Winds, now are not striking the East African Coast below the equator because of a low off the Madagascar coast . The Northward movement of the ITCZ will surely hasten and strengthen the winds.


ii) In the Eastern sector, in the Bay Branch, the Cross equatorial winds are not organised Westwards towards the Sumatra Coast. The winds hitting Sumatra coast are not Westerly (as required), and also need to gather strength soon.Thunder clouds(Cb) developments are seen near the equator in eastern Indian ocean.

And that is exactly where the start should be for the SWM to arrive at the Andamans. 
We prefer the Bay Branch to be better organised, as the SW Monsoon is normally expected there in less than a month.

                --Pressure chart--


Mascarene highs - Main high reading of 1023 mb and another high of 1021 mb is seen in the south Indian ocean between Madagascar and Australia.
This is considerable deterioration compared to the high reading of 1036 mb observed during MW-1.The power house of monsoon is behind schedule as of now.
The sea surface temps in the region of Mascarene High formation are lower than normal .This should help in strengthening the High.


Indicator as on 23 April 2020 : -ve


2. Pre-monsoon showers / LWD (Line of Wind Discontinuity) 

A LWD in the central peninsula region "looks after" the moisture content in the interior areas, and prepares the atmosphere with the humidity required. In reality, this LWD remains till June, in variable phases, and finally merges with the Monsoon trough (axis)/ITCZ  when the ITCZ moves towards the Sub Continent. The seasonal low acts as a fulcrum to this Monsoon trough(axis) as it moves over the subcontinent .Also this trough helps to keep the seasonal low in place.

Good thunderstorms over the Indian peninsula and Kalbaishakis over East /North East India have been observed .

The rainfall has been excessive(blue colour) over most parts of the country during the first half of summer .

Product Not Upload yet...

LWD observed over the Indian peninsula on 23 April 2020

Indicator as on 23 April 2020 : Positive


3. Seasonal low over Indian subcontinent :

This summer there have been no heat waves over the Indian subcontinent till now !!
No 45 c temps have been reported from India till now.Though min temp had touched 30 c only for a day at Barmer during mid April.
In fact temps have been significantly cooler over Northern / Eastern parts of the subcontinent during the past few days .

In 2017Barmer had approached 46 c and recorded min temp above 30 c. April heat records had tumbled at many locations over the Indian subcontinent. 
Temperatures of more than 45 c had already been recorded in many states of India . Even at Srinagar (Kashmir),Shimla (Himachal) temperatures  approached around 29 c in April 2017 . Delhi AP was 44.9 c on 20th April 2017.
In 2017,  Most of India was 4-7c above normal range.

 
Earlier than normal,the night temperatures had also crossed the 30c mark ! Barmer in Rajasthan recorded 30.4c as minimum on 15th April ,Kurnool (Andhra) saw a low of 31 c on 19th morning and Jhansi (UP) saw a low of 31.6 c on 21st morning.
Jaipur,Kota,Bundi,Alwar,Bikaner,Churu,Pilani (Rajasthan), Cuddapah(Andhra) saw lows of/above 30 c on 21st April 2017 morning.


Comparison with previous years shows the difference this year. In 2010, the first 45c touched on 10th April, and on the same day Nagpur was 44c, Delhi 42.8c. Soon on 15 th April 2010,   Simla was 28.2c on 16th, Ganganagar, Akola and Hissar soared to 46c. 


2015...Into the 3rd week of April ,  it had just topped 44.6c in Barmer on 19th April.

2016....touched 46c in Bankura on 16th April...and was constantly hot in Eastern region with almost daily ,a place touching 46c.. Bhubaneshwar and Titlagarh in India had touched 46c. Several large regions in Vidharbh, Telengana and MP were in the 44/43c range.

But, in 2011, 2012, 2013 and 2014, till date in 2020, temperatures were  yet to reach 45c anywhere over the Indian Sub-Continent . 
In 2018 and 2019 also , significant heat waves were not seen by this time in April.

23 April 2020- Max /Min temps in c of some cities/towns :

Barmer.. 41 (0) / 27 (+2)
Jaisalmer.. 38 (-2) / 24 (0) ..7 mms
Nagpur.. 42 (0) / 24 (-1)
Delhi SFD..  35 (-3) / 23 (0)
Angul (Odisha) .. 37 (-4) / 20 (-5)

The heating over the core region of Thar desert is below normal because of Western Disturbances . 
Jaisalmer has reported below normal temps during the past week (18 to 24 April) .
The map below depicts the falling temps (blue areas increasing) over North India during the past few days because of western disturbance.


In spite of no significant heat, the seasonal low has shown a small core of lowest pressure at 1004 mb as compared to 1010 mb during MW-1.But no significant heat wave is expected over the Thar desert core seed region in the coming days of April. (The ultimate low in the core in June should be 994mb).


Indicator as on 23 April 2020 : Neutral ( as even in absence of heat wave , pressure over the Thar desert core seed area has fallen compared to MW-1 )

4. ENSO Status : 

Map of NINO and IOD (DMI) regions

The tropical Pacific remains neutral with respect to the El Nino–Southern Oscillation (ENSO). Atmospheric and oceanic indicators of ENSO including the Southern Oscillation Index (SOI), trade winds, cloudiness near the Date Line, and sea surface and sub-surface temperatures in the tropical Pacific Ocean all continue to persist at levels consistent with neutral ENSO.

i) Multivariate ENSO Index (MEI)  is in neutral range. Current value is 0.2.
The bi-monthly Multivariate El Nino/Southern Oscillation (ENSO) index (MEI) based on five different variables (sea level pressure (SLP), sea surface temperature (SST), zonal and meridional components of the surface wind, and outgoing longwave radiation (OLR)) over the tropical Pacific basin (30°S-30°N and 100°E-70°W).

ii) The Oceanic Nino Index (ONI) is based on SST departures from average in the Nino 3.4 region, and is a principal measure for monitoring, assessing, and predicting ENSO. The last 3 overlapping seasons show towards establishment of a neutral event. ONI latest is 0.5 ( 0.5 to -0.5 is neutral. Above 0.5 is El Nino, and below -0.5 is La Nina).

iii) Current NINO is in neutral range.


iv) The 30 day Southern Oscillation Index (SOI) is calculated using the pressure differences between Tahiti and Darwin.It is in neutral range currently.

(sustained values below -7 indicates El Nino and above +7 indicates La Nina)


SOI values for 23 Apr, 2020
Average SOI for last 30 days-3.05
Average SOI for last 90 days-2.86
Tahiti hpa - Darwin hpa (23 Apr 2020)1013.75 hpa - 1011.10 hpa
v) IOD (Indian Ocean Dipole) is in neutral range currently.
Latest weekly value is -0.09.
ENSO Indicator as on 23 April 2020 : Neutral 

5. April synoptic features :

General April pressure and wind chart


Wind chart on 23 April 2020

The winds North of the Equator are revolving round a High in the Arabian Sea and around a high in the Bay of Bengal.These are normal synoptic features seen in April.
But as the second half of summer progresses , the high over the Bay of Bengal should collapse and give way to the formation of lows over the Bay of Bengal / Andaman sea.

A strong MJO would hasten the favourable formations of lows, with enhanced precipitation. MJO will be in the Indian ocean basin for the next few days and it hopefully would help in the formation of a low within 7 days in the Bay of Bengal/Andaman sea.

Another factor, which helps the winds gain strength, and bring more moisture into the Indian landmass, is the sea temperatures (SST) on both sides of the Peninsula. Optimum (warm) temperatures will hasten and create more clouds, and help in faster forming of the lows from the Bay. Currently , the sea temperatures on both sides of the Indian Peninsula are more than 30 c (above normal) .


ITCZ (Inter Tropical Convergence Zone)This Seasonal trough passes from the South Arabian Sea to Andaman sea after the withdrawal of SWM in Oct. Shifts further south in Dec. Moves North during South West Monsoon.

Now south of the equator (5S) over western Indian ocean and near the equator over the eastern Indian ocean.

Indicator as on 23 April 2020 : Normal 

Summary as on 23 April 2020 :


Situations can change fast, and by the time we discuss the next MW, some factors can suddenly become +ve or -ve. So, MW discusses and follows the developments as they emerge, and discuss the parameters as is where is.

Please note  There are more parameters to be considered, as and when they are developed and to be taken into consideration in the subsequent Monsoon Watch (MW) series.
Time schedule of arrival and strength/quantum is normally indicated in subsequent MW series in May. 

To read MW-1 2020 article ,click on the link below :

Thursday, April 23, 2020

Weekend (24th-26th) Warning:
Thunderstorms likely in Kolkata. Particularly heavy on Friday /Saturday with strong winds. Maximium day temperatures around 30c.
Thunder Showers likely in Bhubaneshwar. Heavy rains in parts on the weekend.

Light rains likely in Jabalpur .

Monsoon Watch -2:  Will be published here on 24th April by 1 pm IST

See "Space News " Page updated

Wednesday, April 22, 2020


Posted 22nd April 2020
Weather Knowledge -3

Today is Earth Day..Protect the Species..and Happy Earth Day


In the first few days of the lockdown, it was difficult to observe a change in the pollution signature. “We saw an aerosol decrease in the first week of the shutdown, but that was due to a combination of rain and the lockdown,” said Gupta. Around March 27, heavy rain poured over vast areas of northern India and helped clear the air of aerosols. Aerosol concentrations usually increase again after such heavy precipitation.
“After the rainfall, I was really impressed that aerosol levels didn’t go up and return to normal,” Gupta added. “We saw a gradual decrease, and things have been staying at the level we might expect without anthropogenic emissions.”
The chart above shows daily average aerosol optical depth measurements over northern India from January 1 to April 5, 2020, as compared to the 2016-2019 average. Note that the rise in AOD at the end of February coincided with fire activity in the Indian state of Punjab and in neighboring Pakistan.
According to Gupta, AOD levels in northern India at the beginning of April were significantly below the norm for this time of year and the lowest in 20 years of MODIS observations. Ground observation stations in India have also reported a decrease in particle pollution in the region. Anecdotally, people in the northern state of Punjab have reported seeing the Himalayas for the first time in decades.
In southern India though, the story is a little hazier. Satellite data show aerosol levels have not yet decreased to the same extent; in fact, levels seem to be slightly higher than in the past four years. The reasons are unclear, but could be related to recent weather patterns, agricultural fires, winds, or other factors.
“This a model scientific experiment,” said Levy about the lockdown and its effects on pollution. “We have a unique opportunity to learn how the atmosphere reacts to sharp and sudden reductions in emissions from certain sectors. This can help us separate how natural and human sources of aerosols affect the atmosphere.”

International Boundaries in this map are incorrect

On March 25, 2020, the Indian government placed its 1.3 billion citizens under a strict lockdown to reduce the spread of the COVID-19 coronavirus. The country-wide mandate decreased activity at factories and severely reduced car, bus, truck, and airplane traffic. After just a week of reduced human activities, NASA satellite sensors observed aerosol levels at a 20-year low for this time of year in northern India.
Every year, aerosols from anthropogenic (human-made) sources contribute to unhealthy levels of air pollution in many Indian cities. Aerosols are tiny solid and liquid particles suspended in the air that reduce visibility and can damage the human lungs and heart. Some aerosols have natural sources, such as dust storms, volcanic eruptions, and forest fires. Others come from human activities, such as the burning of fossil fuels and croplands. Human-made aerosols tend to contribute most of the smaller particles that have greater potential for damaging human health.
“We knew we would see changes in atmospheric composition in many places during the lockdown,” said Pawan Gupta, a Universities Space Research Association (USRA) scientist at NASA’s Marshall Space Flight Center. “But I have never seen aerosol values so low in the Indo-Gangetic Plain at this time of year.”
The first five maps above show aerosol optical depth (AOD) measurements over India during the same March 31 to April 5 period for each year from 2016 through 2020. The sixth map (anomaly) shows how AOD in 2020 compared to the average for 2016-2019. Aerosol optical depth is a measure of how light is absorbed or reflected by airborne particles as it travels through the atmosphere. If aerosols are concentrated near the surface, an optical depth of 1 or above indicates very hazy conditions. An optical depth, or thickness, of less than 0.1 over the entire atmospheric vertical column is considered “clean.” The data were retrieved by the Moderate Resolution Imaging Spectroradiometer (MODIS) on NASA’s Terra satellite.
In a typical early spring in the Ganges Valley of northern India, human activities generate the majority of aerosols. Motor vehicles, coal-fired power plants, and other industrial sources around urban areas produce nitrates and sulfates; coal combustion also produces soot and other carbon-rich particles. Rural areas add smoke—rich in black carbon and organic carbon—from cooking and heating stoves and from prescribed burns on farms (though farming fires more often occur at other times of year). By all accounts, the 2020 lockdown reduced those human-made emission sources.
Scientists expect aerosol levels to increase slightly in upcoming weeks in parts of India as seasonal dust storms begin. Dust concentrations are typically low in March and early April, before temperatures rise and strong westerly winds blow sand in from the Thar Desert and Arabian Peninsula. The question is whether overall AOD will remain below normal.
“The hard part with understanding aerosols is that particles can move based on wind patterns and other meteorology,” said Robert Levy, program leader for NASA’s MODIS aerosol products. “You have to disentangle what is caused by the human fingerprint versus a meteorological factor.

NASA Earth Observatory images by Joshua Stevens, using Terra MODIS analysis courtesy of Pawan Gupta/USRA/NASA. Story by Kasha Patel with image interpretation from Hiren Jethva, Rob Levy, and Ralph Kahn.

Monday, April 20, 2020

Heatwave like conditions grips the interior parts of N.Konkan region of Maharashtra on 20-04-2020

Today Eastern suburbs of Mumbai witnessed it's 2nd 40C temp of yr 2020!

Some max temp in °C below with humidity for some available location :

Palghar & Virar 40.2 

Manor 40.2 with 20%

Bhayandar, Chembur & Navi Mumbai (Vashi) 40.4

IIT Powai 40.4 with 26%


Bhandup & Mulund 40.6

Belapur, Turbhe & Panvel 40.6

Mumbra 40.6 with 12%

Thane 40.8 with 14%


Badlapur 40.8 with 24%

Kalyan-Dombivli 41.4

Bhiwandi 41.6 with 14%

Shahapur & Wada 42

Kalwa & Padgha 42.4


Talasari & Kasara 42.8

Tokawade & Khopoli 43


Karjat, Lonere & Murbad 43.4


So Practically interior parts of North Konkan in Palghar, Thane & Raigad dist of Maharashtra may have seen highest possibly temps in India today but lack of IMD official stations doesn't depict the same  


Data Courtesy: IMD, Mahavedh,BMC,TMC AWS & PWS


MAHARASHTRA TEMPS on 20 April 2020..

Highest.. Karjat (Interior Kokan) 43 c 
Lowest.. Mahabaleshwar (Sahyadri) 33 c

Kokan region max temps were above normal by 2 to 4 c ..
Elsewhere in the state ,max temps were near normal..


Highest min..Devgad & Panji (Coastal Kokan Goa) 28 c 
Lowest min..Mahabaleshwar 15 c (during a thunderstorm yesterday)

Chandrapur(eastern Vidarbha) reported min temp of 20 c (below normal by 6 c) due to thunderstorm activity at night..


-----------------------------------------------
For a change , Mumbai was hot and dry today.Humidity was around 25 to 40 %  with temps hovering around the 37 c mark for most part of the day.

For the next 4 days ,
Kokan and Madhya Maharashtra temps are expected to decrease and return to normal levels.Thunderstorm activity will reduce.
Humidity will increase along the Kokan coast.Breezy weather will provide some relief.

Marathwada temps will hover around normal levels.
Vidarbha temps will increase as thunderstorm activity over the region decreases in the coming days.


  Posted 18th Afternoon: Mumbai : Much hear say about rains increasing, cyclones coming in end of September ! Vagaries ' outlook for  18...