November 07, 2025
Deaths from Extreme Weather are Rapidly Declining
There is a lot of talk about extreme weather these days, with many climate activists and media suggesting that deaths and injuries from extreme weather are increasing due to human-caused global warming.
However, the truth is very different:
Deaths from extreme weather are actually decreasing rapidly for several reasons.
You read that correctly: declining.
To illustrate, the figure below shows the number of global deaths from floods, droughts, storms, wildfires, and extreme temperatures from the 1920s to 2021, based on a respected international database.
Huge declines in deaths. And this is not including the fact that the population has increased immensely during the past century.
Thus, personal risk from extreme weather is going down even faster!.


(2) The ability to communicate threats is WAY better than 40 years ago, with people in even poor countries possessing smartphones that provide updated warnings.

There are several articles in the peer-reviewed literature that explicitly state this: warming temperatures will reduce extreme temperature deaths.

Hurricanes? The ability to forecast their track has become much, much better. At the same time, the frequency of major hurricanes has been stable as the Earth has warmed considerably during the past few decades.

Same thing with the number of landfalling storms. No upward trends as the planet warms.

Even with an immense increase in population in the coastal zone, the number of hurricane deaths from Atlantic hurricanes and tropical storms is nearly constant (see below). Thus, personal risk is immensely LESS.

-------------------------------------------------------------------------------------------------------------------------------------------------------------------------------------------------------------------
https://mausam.imd.gov.in/responsive/monsooninformation.php
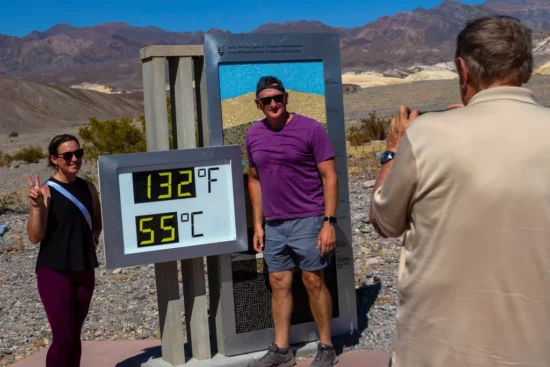
AP photo/ Ty O’Neil.
Summary
- Previous research has shown the temperatures recorded at Death Valley National Park (DVNP) have curious warm biases on very hot days, possibly due to instrument deficiencies or proximity to mounting structure apparatus and other manmade structures.
- Here it is shown from 21 years of summertime (June, July, August) data that DVNP has many more days when temperatures are much higher than those at the nearby Stovepipe Wells station, than when Stovepipe Wells has hotter days than DVNP station.
- These lines of evidence suggest that the hot summer daytime temperatures reported at Death Valley National Park have potentially large biases, and should only be used for their entertainment value.
In our continuing examination of the world record hottest temperature of 134 deg. F recorded at Greenland Ranch (now Death Valley National Park station) on 10 July 1913, we are finding some curious behavior in recent summertime temperatures there. (The Bulletin of the American Meteorological Society [BAMS] has accepted my proposal for a BAMS article showing the evidence that the 134 deg. F world record was 8 to 10 deg. F higher than what actually existed on that date [10 July 1913]).
More Evidence: DVNP vs. Stovepipe Wells Temperatures
For the last 21 years there have been two stations in Death Valley: the DVNP station next to the Furnace Creek Visitors Center, and a climate reference network (CRN) station at Stovepipe Wells, 29 km northwest of the DVNP station.
Fig. 2 shows a comparison of the daily maximum temperatures (Tmax) recorded at these two stations for every day in June, July, and August in all years from 2004 through 2024.
Comparison between daily high temperatures (Tmax) recorded at Stovepipe Wells and Death Valley National Park, for all days in June, July, and August for the years 2004 through 2024. The dashed red line represents the median difference between the 2 stations (2 deg. F, DVNP warmer than Stovepipe Wells). Gray lines connect the days in chronological order.
The median of the Tmax differences between these 2 stations is 2 deg. F (DVNP warmer, represented by the dashed red line), while the average- difference is 2.3 deg. F. The expected difference based upon elevation alone is 1.3 deg. F (DVNP station is 278 ft lower in elevation than Stovepipe Wells).

Note in Fig. 2 that there seem to be more outliers to the left of the dashed red line than to the right. That is, there are more days where DVNP is much warmer than Stovepipe Wells than there are days when Stovepipe Wells is much warmer than DVNP station.
This suggests there is something wrong with the Death Valley National Park instrumentation itself or the immediate environment around the temperature sensor that causes some days to be biased too hot. Bill Reid, who has researched this issue extensively, suspects that days with low wind have excessive heat build-up at the DVNP thermometer site, both in the general area around the instrumentation, and due to the non-aspirated design of the temperature sensor used there.
Conclusions
The evidence presented here, along with evidence presented previously by Bill Reid, Dirk Baker, and others, suggests that Death Valley National Park temperatures should not be relied upon for accurate daytime readings, and that near-record temperatures there are biased too high. The reasons for the biases are not obvious, but the evidence suggests poor sensor ventilation during the daytime when various structures in the vicinity heat up: whether the shield of the sensor itself, its supporting structure, or various manmade objects around the station site. It is also possible that the trees and other structures to the south of the station restrict air flow, further reducing effective convective heat transport away from the solar heated desert surface.
It is my opinion that “official” Death Valley temperatures should use the Stovepipe Wells site data, which come from state-of-the-art Climate Reference Network instrumentation. The traditional site near the Death Valley National Park Visitors Center should only be used for entertainment purposes.
Maybe the National Park Service should investigate adding a CRN station; a good location would be about 1.6 km southwest of the current station, well away from the Furnace Creek tourist area.
.png)
.png)
.png)

.png)
Records shattering Mocha
With a wind speed of 150 knots Cyclone Mocha equals the record of cyclone Fani of being the strongest north Indian Ocean cyclone since 1982 (including all months and both the Arabian Sea and the Bay of Bengal).
Cyclone Mocha is the strongest cyclone on earth till date among all the 16 cyclones this year.
(Note Data is as per JTWC. Analysed by Vagarian Vineet.)
As per JTWC Cyclone Mocha made landfall with winds close to 135 knots.
Strongest cyclones in the North Indian Ocean having maximum winds of 115 knots or higher (as per Joint Typhoon Warning Center records):
Mocha (BoB, May 2023) 150 knots
Fani (BoB, May 2019) 150 knots
Amphan (BoB, May 2020) 145 knots
Gonu (AS, June 2007) 145 knots
1999 Super cyclone (BoB, October 1999) 140 knots
Phailin (BoB, October 2013) 140 knots
Sidr (BoB, November 2007) 140 knots
1991 (BoB, April 1991) 140 knots
Kyarr (AS, October 2019) 135 knots
Giri (BoB, October 2010) 135 knots
Chapala (AS, October 2015) 130 knots
Phet (AS, June 2010) 125 knots
1994 (BoB, April 1994) 125 knots
1990 (BoB, May 1990) 125 knots
Tauktae (AS, May 2021) 120 knots
Mala (BoB, April 2006) 120 knots
1999 (BoB, October 1999) 120 knots
1982 (BoB, April 1982) 120 knots
Hudhud (BoB, October 2014) 115 knots
Nilofar (AS, November 2014) 115 knots
Nargis (BoB, April 2008) 115 knots
1997 (BoB, May 1997) 115 knots
1996 (BoB, November 1996) 115 knots
Note: The naming of cyclones in the North Indian Ocean started from 2004.
Pune April Temps Daily


Hottest Year on Record In India:
They are 2016, 2023, 2009, 2017 and 2010 (in descending order). New Delhi: The year 2023 ended as the second warmest on record for India since 1901, the India Meteorological Department said on Monday, noting that months of August and February were the warmest in the last 123 years.
March: The average maximum temperature of 33.10 degrees Celsius recorded in March 2022 is the highest ever in last 122 years, according a statement on Saturday by the India Meteorological Department. In March 2010, the country had recorded a maximum temperature of 33.09 degrees Celsius.
The IMD said the average maximum, minimum and mean temperatures for the country as a whole last month were 33.10 degrees C, 20.24 degrees C and 26.67 degrees C respectively, against the normal of 31.24 degrees C, 18.87 degrees C and 25.06 degrees C, respectively, based on the period 1981-2010. The country’s average mean temperature of 26.67 degrees C in March was the second highest after 26.671 degrees C recorded in March 2010.
The weather office attributed the unusually hot month to the absence of active western disturbance over north India and of any major easterly system over south India, causing subdued rainfall and very less thunderstorm activities over most parts of the country.
The rainfall recorded last month in the country as a whole was 8.9 mm, which was 71 per cent less than its long period average rainfall of 30.4 mm.
The countrywide average minimum temperature of 20.24 degrees Celsius in March this year was the third highest in 122 years.
Climate Change and Warning Models and Observations...By Roy Spencer PhD...Climatologist, Former NASA Scientist
The most important thing to remember about climate models which are used to project future global warming is that they were “tuned” with the assumption I started this article with: that the climate system is in a natural state of energy balance, and that there is no long-term climate change unless humans cause it.
This is an arbitrary and illogical assumption. The climate system is an example of a “nonlinear dynamical system”, which means it can change all by itself. For example, slow changes in the rate of vertical overturning of the world’s oceans can cause global warming (or global cooling) with no “external forcing” of the climate system whatsoever.
Instead, the climate models are “tuned” to not produce natural climate change. If a 100-year run of the model produces change, the model is adjusted to removed the “drift”. The models do not produce global energy balance from “first physical principles”, because none of the processes controlling that balance are known to sufficient accuracy. Instead, the models are “fudged” to produce energy balance, based upon the modelers’ assumption of no natural climate change. Then, the models are used as “proof” that only increasing CO2 has caused recent warming.
This is circular reasoning.
I am not against modeling; models are necessary to understand complex processes in the climate system. But, while the models are useful and necessary tools for studying climate change, I do not think they can yet be relied upon for major changes in energy policy.
Believe it or not, very little research has ever been funded to search for natural mechanisms of warming…it has simply been assumed that global warming is manmade. This assumption is rather easy for scientists since we do not have enough accurate global data for a long enough period of time to see whether there are natural warming mechanisms at work.
It is simply what the climate system does. This is actually quite easy for meteorologists to believe, since we understand how complex weather processes are.
With a wind speed of 150 knots Cyclone Mocha equals the record of cyclone Fani of being the strongest north Indian Ocean cyclone since 1982 (including all months and both the Arabian Sea and the Bay of Bengal).
Cyclone Mocha is the strongest cyclone on earth till date among all the 16 cyclones this year.
(Note Data is as per JTWC. Analysed by Vagarian Vineet.)
As per JTWC Cyclone Mocha made landfall with winds close to 135 knots.
Strongest cyclones in the North Indian Ocean having maximum winds of 115 knots or higher (as per Joint Typhoon Warning Center records):
Mocha (BoB, May 2023) 150 knots
Fani (BoB, May 2019) 150 knots
Amphan (BoB, May 2020) 145 knots
Gonu (AS, June 2007) 145 knots
1999 Super cyclone (BoB, October 1999) 140 knots
Phailin (BoB, October 2013) 140 knots
Sidr (BoB, November 2007) 140 knots
1991 (BoB, April 1991) 140 knots
Kyarr (AS, October 2019) 135 knots
Giri (BoB, October 2010) 135 knots
Chapala (AS, October 2015) 130 knots
Phet (AS, June 2010) 125 knots
1994 (BoB, April 1994) 125 knots
1990 (BoB, May 1990) 125 knots
Tauktae (AS, May 2021) 120 knots
Mala (BoB, April 2006) 120 knots
1999 (BoB, October 1999) 120 knots
1982 (BoB, April 1982) 120 knots
Hudhud (BoB, October 2014) 115 knots
Nilofar (AS, November 2014) 115 knots
Nargis (BoB, April 2008) 115 knots
1997 (BoB, May 1997) 115 knots
1996 (BoB, November 1996) 115 knots
Note: The naming of cyclones in the North Indian Ocean started from 2004.
Hottest Year on Record In India:
They are 2016, 2023, 2009, 2017 and 2010 (in descending order). New Delhi: The year 2023 ended as the second warmest on record for India since 1901, the India Meteorological Department said on Monday, noting that months of August and February were the warmest in the last 123 years.
March: The average maximum temperature of 33.10 degrees Celsius recorded in March 2022 is the highest ever in last 122 years, according a statement on Saturday by the India Meteorological Department. In March 2010, the country had recorded a maximum temperature of 33.09 degrees Celsius.
The IMD said the average maximum, minimum and mean temperatures for the country as a whole last month were 33.10 degrees C, 20.24 degrees C and 26.67 degrees C respectively, against the normal of 31.24 degrees C, 18.87 degrees C and 25.06 degrees C, respectively, based on the period 1981-2010. The country’s average mean temperature of 26.67 degrees C in March was the second highest after 26.671 degrees C recorded in March 2010.
The weather office attributed the unusually hot month to the absence of active western disturbance over north India and of any major easterly system over south India, causing subdued rainfall and very less thunderstorm activities over most parts of the country.
The rainfall recorded last month in the country as a whole was 8.9 mm, which was 71 per cent less than its long period average rainfall of 30.4 mm.
The countrywide average minimum temperature of 20.24 degrees Celsius in March this year was the third highest in 122 years.
Climate Change and Warning Models and Observations...By Roy Spencer PhD...Climatologist, Former NASA Scientist
The most important thing to remember about climate models which are used to project future global warming is that they were “tuned” with the assumption I started this article with: that the climate system is in a natural state of energy balance, and that there is no long-term climate change unless humans cause it.
This is an arbitrary and illogical assumption. The climate system is an example of a “nonlinear dynamical system”, which means it can change all by itself. For example, slow changes in the rate of vertical overturning of the world’s oceans can cause global warming (or global cooling) with no “external forcing” of the climate system whatsoever.
Instead, the climate models are “tuned” to not produce natural climate change. If a 100-year run of the model produces change, the model is adjusted to removed the “drift”. The models do not produce global energy balance from “first physical principles”, because none of the processes controlling that balance are known to sufficient accuracy. Instead, the models are “fudged” to produce energy balance, based upon the modelers’ assumption of no natural climate change. Then, the models are used as “proof” that only increasing CO2 has caused recent warming.
This is circular reasoning.
I am not against modeling; models are necessary to understand complex processes in the climate system. But, while the models are useful and necessary tools for studying climate change, I do not think they can yet be relied upon for major changes in energy policy.
Believe it or not, very little research has ever been funded to search for natural mechanisms of warming…it has simply been assumed that global warming is manmade. This assumption is rather easy for scientists since we do not have enough accurate global data for a long enough period of time to see whether there are natural warming mechanisms at work.
It is simply what the climate system does. This is actually quite easy for meteorologists to believe, since we understand how complex weather processes are.
all this teeth gnashing over what models should be included just shows now unready for primetime the state of the models are.
projections need to be keyed to observations and far from it is that recommendation only coming from roy. dr curry and others have been calling for that for years.
its obvious that our policies should follow from real observations and not projections that nobody is in agreement with.
U.S.A. Temperature Trends, 1979-2023: Models vs. Observations
February 2nd, 2024 by Roy W. Spencer, Ph. D.

Updated through 2023, here is a comparison of the “USA48” annual surface air temperature trend as computed by NOAA (+0.27 deg. C/decade, blue bar) to those in the CMIP6 climate models for the same time period and region (red bars). Following Gavin Schmidt’s concern that not all CMIP6 models should be included in such comparisons, I am only including those models having equilibrium climate sensitivities in the IPCC’s “highly likely” range of 2 to 5 deg. C for a doubling of atmospheric CO2.
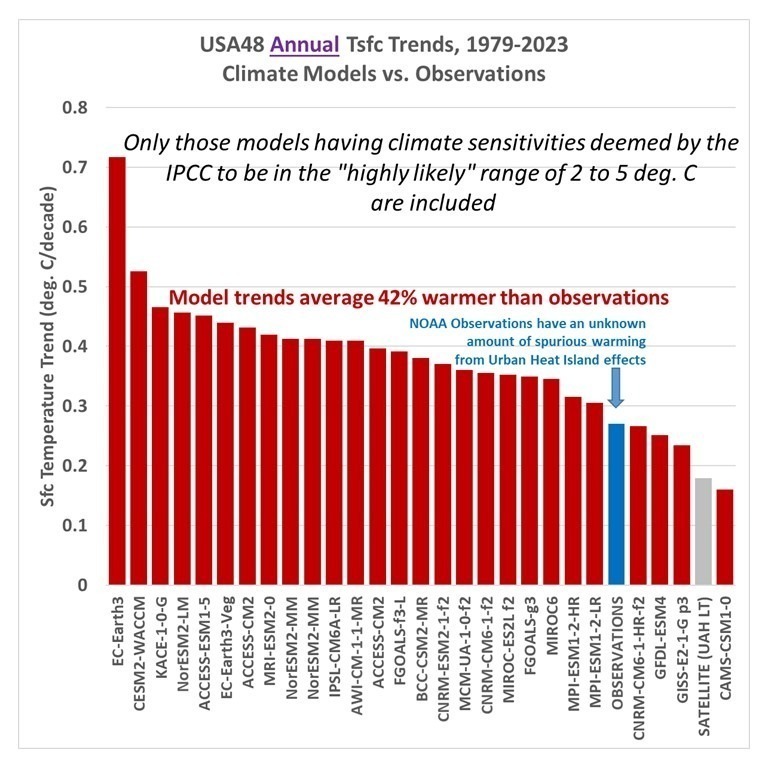
Approximately 6 times as many models (23) have more warming than the NOAA observations than those having cooler trends (4). The model trends average 42% warmer than the observed temperature trends. As I allude to in the graph, there is evidence that the NOAA thermometer-based observations have a warm bias due to little-to-no adjustment for the Urban Heat Island effect, but our latest estimate of that bias (now in review at Journal of Applied Meteorology and Climatology) suggests the UHI effect in the U.S. has been rather small since about 1960.
Note I have also included our UAH lower tropospheric trend, even though I do not expect as good agreement between tropospheric and surface temperature trends in a regional area like the U.S. as for global, hemispheric, or tropical average trends. Theoretically, the tropospheric warming should be a little stronger than surface warming, but that depends upon how much positive water vapor feedback actually exists in nature (It is certainly positive in the atmospheric boundary layer where surface evaporation dominates, but it’s not obviously positive in the free-troposphere where precipitation efficiency changes with warming are largely unknown. I believe this is why there is little to no observational evidence of a tropical “hot spot” as predicted by models).
now switch to a comparison for just the summer months (June, July, August), the discrepancy between climate model and observed warming trends is larger, with the model trends averaging 59% warmer than the observations:
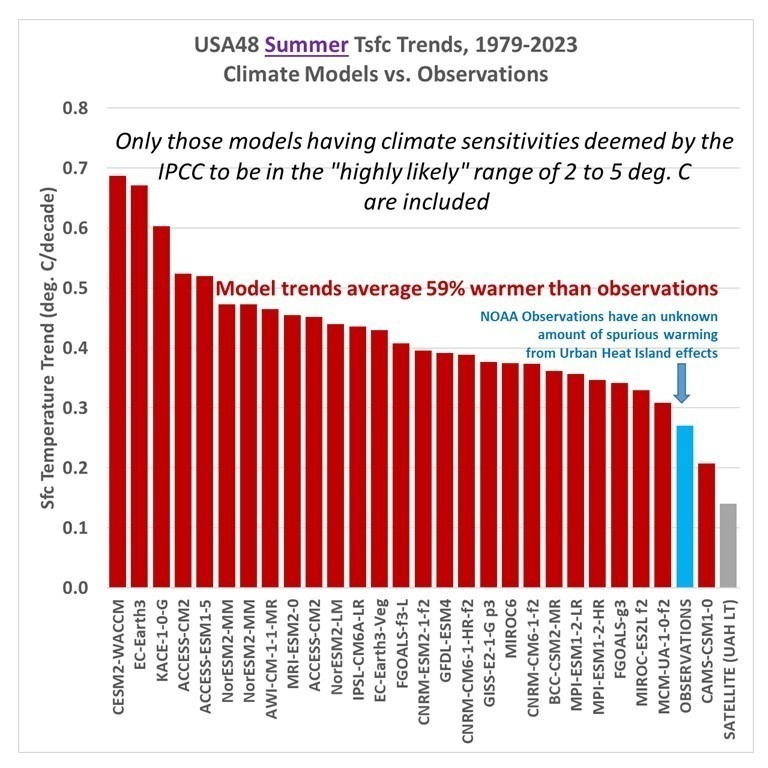
Now switch to a comparison for just the summer months (June, July, August), the discrepancy between climate model and observed warming trends is larger, with the model trends averaging 59% warmer than the observations:
For the summer season, there are 26 models exhibiting warmer trends than the observations, and only 1 model with a weaker warming trend. The satellite tropospheric temperature trend is weakest of all.
Given that “global warming” is a greater concern in the summer, these results further demonstrate that the climate models depended upon for public policy should not be believed when it comes to their global warming projections.
------------------------------------------------------------------------------------------------------------
The rainfall in Kerala during the monsoon season is decreasing at the rate of 16.2mm/decade.

Konkan Goa monsoon rainfall (1901-2022)
Konkan Goa subdivision rainfall is increasing at the rate of 61.8mm/decade in the monsoon season for the period 1901-2022.

Mahabaleshwar rain 1 June - 26 August
See more on Dr.Vineet's Page
Variation in the daily rainfall in Mahabaleshwar this season


Data compiled by Vagarian Vineet Kumar (IITM Fellow Reseacher)
 |

 From ToI


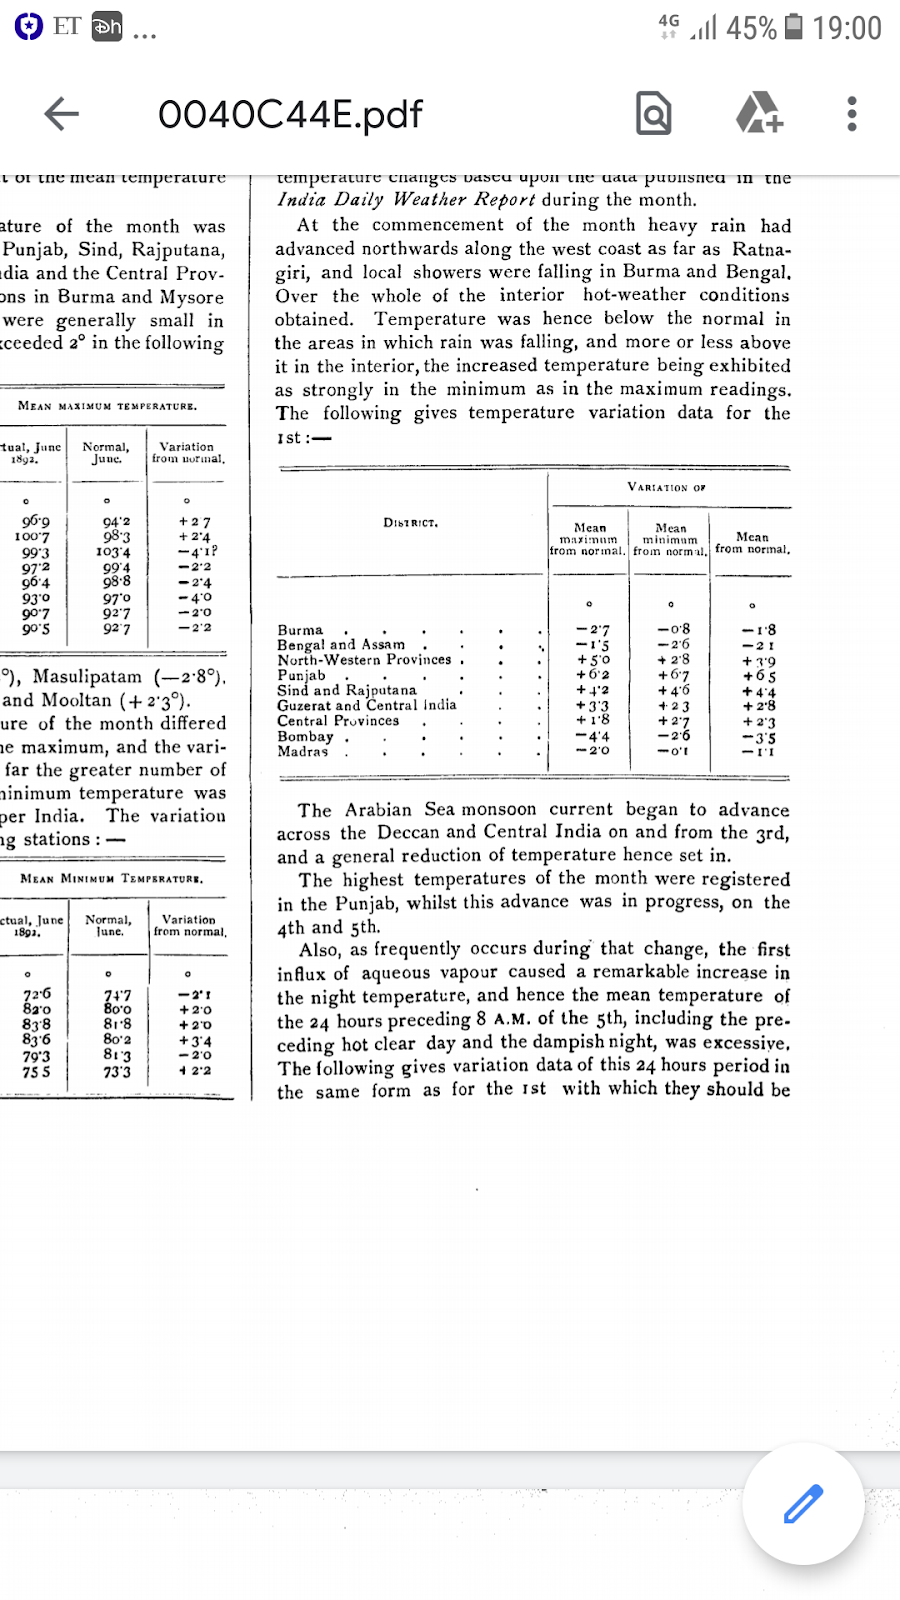
1892 year, a year which will be remembered as very dry and hot winters, very dry and hot summers but good monsoon especially in last 2 months of monsoon. Temperature in all winter and summer months were excessively above normal just opposite of its last year 1891 when temperatures were excessively below normal in its winter and summer months. Below image shown are temperature data of various parts of India of January and Feb month (All data is in Fahrenheit. To convert it into Celsius just divide it by 1.8)
Below attached image shows temperature data of March,April,May month of various parts of India. You can see how high the temperature were in 1st 5 months of the year especially in upper and western parts of India. (All data in Fahrenheit to convert it into Celsius just divide it by 1.8)


Temperature in March month itself become so high that it already touched to 43-46c range in most parts of N, W and central parts of India shattering many past records.
Deesa(Gujarat) 46c shattering 43c record of March 1880
Pachpadra (Rajputana) 45c shattering 44c record of March 1880
Sirsa (Rajasthan) 44c shattering 39c record of March 1880
Nagpur 45c shattering 43c record of March 1880
Rajkot 44c shattering 43c record of March 1880
Indore 41c shattering 40c record of March 1880.
Jacodabad 44c shattering 43c record of March 1880
Same record breaking heat continues even in April shattering many past records
Deesa 46c shattering 44c record of April 1880
Dera Ismail khan 45c shattering 44c record of April 1880
Nagpur 46c shattering 45c record of April 1879
Sholapur 44c shattering 43.7c record of April 1881
Rajamundhry(Madras) 44.5c shattering 43c record of April 1888
Jacodabad 47c shattering 46c record of April 1880.
In last week of April a small cyclonic storm of considerable intensity formed in Arabian sea and has made landfall over kathiawar (Sauarshtra) just to the west of Mandvi on May 1. The average velocity of wind between 10 am to 1:30 pm in Bhuj almost exceeded 100 miles per hour (161 km/h) causing the massive damage. In whole of Kutch 38 persons were killed while 141 people were wounded. About 98,000 houses were damaged, 30 boats were destroyed. About 1,26,000 trees were uprooted and 5,00,000 trees were much injured.
After first week of May temperature started rising considerably with some stations again breaking the past records while many other stations near to breaking its past records
Rajamundhry (Madras) 47c on 14th May shattering 46c record of May 1887
Cuddapah (Deccan) 45c on 14th and 16th May shattering 44c record of May 1886
Jacodabad 49.4c. Earlier record 50.5c of May 1888
Lahore 48c. Earlier record 49c of May 1879
Bikaner 45c on 21st and 31st May
Jeypore(Rajputana) 45c on 21st
Deesa 43c. Earlier record 47.4c of May 1881
In June month monsoon remained very poor especially the Arabian sea branch and so temperature remained above normal in most parts of upper and western India
(Data given here is in Fahrenheit. To convert it into Celsius just divide it by 1.8.) So straight 6th month temperature remained above normal for upper and western India. Except deccan plateau and Madras whole India received scanty rain

It seems summers is in no mood to leave India as straight 7th month India was under the grip of deadly heat shattering many past records due to massive failure of monsoon.
Dera Ismail khan 49c (10c above normal) shattering 47.5c record of July 1888
Lahore 47.3c.(9c above normal) Record not broken (47.5c in July 1878)
Peshawar 47c shattering 46c record of July 1887
Jacodabad 47c. Record not broken (48.6c in July 1878)
Agra 46c(12.5c above normal) shattering 44c record of July 1868
From the last week of July finally monsoon currents became strong and gave bountiful rain in almost all parts of India which continued even in August month

Rainfall was largely in excess in all parts of India in August month as can be seen in above image giving much relief from prolonged heat waves. Many flood events occurred in Punjab and Sindh in August month. Nothing remarkable happened in September and October month.
North East monsoon which gives rainfall to South east coast in November and December month completely failed.
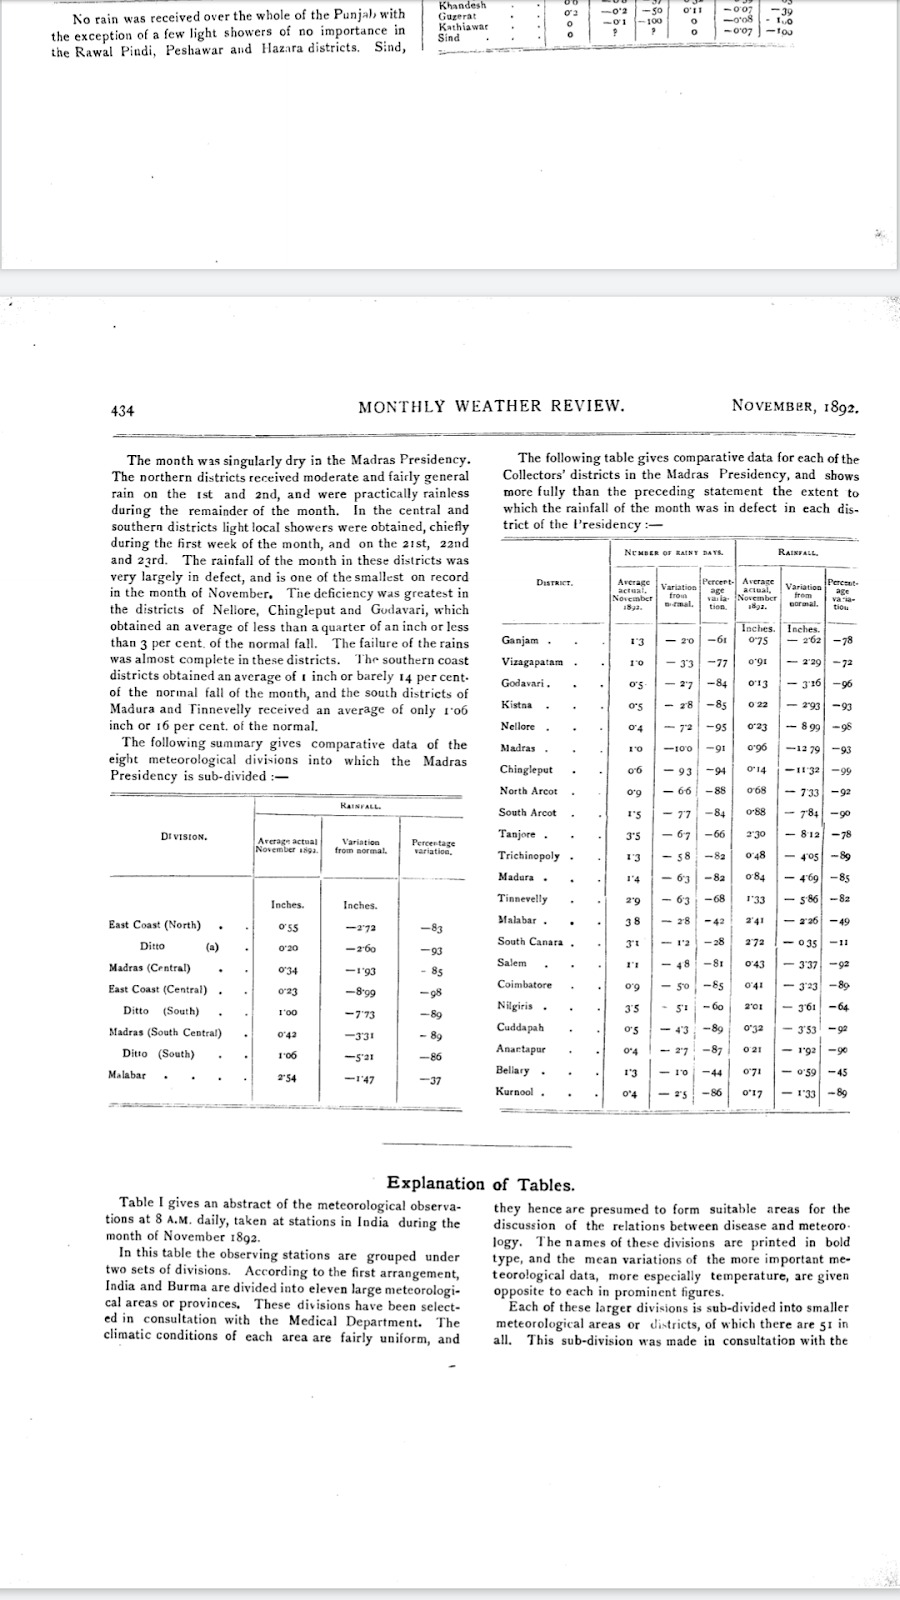
As you can see whole SE coast of India were largely in deficit. Even in December month north east monsoon failed considerably.


Here is the list below for decade avg:
West M.P. (Annual)
From Vagarian Puneet (Dombivali)


| 1901-1910 | 10257 |
| 1911-1920 | 11057 |
| 1921=1930 | 10605 |
| 1931-1940 | 11143 |
| 1941-1950 | 10915 |
| 1951-1960 | 12441 |
| 1961-1970 | 10503 |
| 1971-1980 | 11689 |
| 1981-1990 | 12242 |
| 1991-2000 | 12127 |
| 2001-2010 | 11162 |
| 2011-2019 | 10166 |
Over the decades, I do not see major variations or Rise/Fall in the rainfall..Your comments please
All Information compiled by Vag. Shitij


