| RAINFALL REPORT FOR THE PERIOD 1-3-2018 TO 31-5-2018 | |||
| TOTAL ALL INDIA RAINFALL FOR THE PERIOD (mm) | 117.0 | (131.50) | |
| SEASON +/- | -11% | ||
| SUBDIVISION | ACTUAL RAINFALL | NORMAL RAINFALL | DEP +/- |
| LAKSHADWEEP | 580.5 | 232.4 | 150% |
| KERALA | 522.4 | 379.7 | 38% |
| ARUNACHAL PRADESH | 507.8 | 750.4 | -32% |
| A & N ISLAND | 483.9 | 465.0 | 4% |
| SHWB & SIKKIM | 466.8 | 457.1 | 2% |
| N M M T | 461.7 | 494.1 | -7% |
| ASSAM & MEGHALAYA | 451.7 | 590.2 | -23% |
| COASTAL KARNATAKA | 334.8 | 178.8 | 87% |
| JAMMU & KASHMIR | 240.7 | 326.0 | -26% |
| S. I. KARNATAKA | 236.4 | 145.2 | 63% |
| GANGETIC WEST BENGAL | 165.1 | 164.8 | 0% |
| ODISHA | 162.9 | 134.7 | 21% |
| TAMILNADU & PONDICHERY | 158.6 | 128.1 | 24% |
| HIMACHAL PRADESH | 141.1 | 244.9 | -42% |
| UTTARAKHAND | 136.3 | 156.0 | -13% |
| N. I. KARNATAKA | 124.7 | 85.1 | 47% |
| COASTAL ANDHRA PRADESH | 96.5 | 97.0 | -1% |
| RAYALASEEMA | 87.8 | 82.0 | 7% |
| JHARKHAND | 83.3 | 79.4 | 5% |
| TELANGANA | 68.1 | 56.8 | 20% |
| BIHAR | 58.2 | 77.5 | -25% |
| CHHATTISGARH | 57.0 | 46.8 | 22% |
| EAST UTTAR PRADESH | 33.9 | 31.7 | 7% |
| WEST UTTAR PRADESH | 26.3 | 29.1 | -9% |
| PUNJAB | 25.2 | 53.5 | -53% |
| KONKAN & GOA | 24.3 | 37.2 | -35% |
| HAR. CHD & DELHI | 22.0 | 34.2 | -36% |
| VIDARBHA | 17.9 | 30.9 | -42% |
| MADHYA MAHARASHTRA | 15.9 | 37.8 | -58% |
| MARATHWADA | 15.3 | 30.3 | -50% |
| EAST MADHYA PRADESH | 14.7 | 25.1 | -41% |
| EAST RAJASTHAN | 6.9 | 17.4 | -60% |
| WEST RAJASTHAN | 4.8 | 19.1 | -75% |
| WEST MADHYA PRADESH | 4.5 | 13.5 | -67% |
| GUJARAT REGION | 0.2 | 6.7 | -97% |
| SAURASHTRA & KUTCH | 0.1 | 4.0 | -96% |
| SOURCE | IMD |
Thursday, May 31, 2018
Tuesday, May 29, 2018
IMD announces Arrival of South West Monsoon in Kerala...
Its a "Pseudo" Arrival of Monsoon...!
However, the Monsoon has been advanced by IMD in spite of certain important criteria like OLR and 850 winds direction not upto the specified mark. The wind depth is also not sufficient.
AS-3 system bringing rainfall to Kerala and Karnataka coast has prompted the announcement.
However, it could be termed as a "Pseudo" Arrival...
Sunday, May 27, 2018
Posted 27th May ...Evening:
The Low AS-3 has formed off the Karnatak/Kerala coast, as estimated in our 24th post. The Low is embedded in the off shore trough, and is not expected to strengthen much, but only strengthen the trough.
SST have dropped off the Somalia coast ..with the latest around 22c after "Mekunu"

The South West Monsoon Northern Limit as on 27th May is seen in map below:

Monsoon will advance into Sri Lanka by 29th May. Likely to move into South Kerala coast by 1st June.
Mumbai will be partly cloudy . Light pre monsoon drizzles expected in some parts on 29th and 30th May. Colaba night temperatures will be around 29c ! Possibility of nearing record all time high minimum. (30.2c on 10th June 2016..http://vagariesmum.blogspot.in/).
Water levels o Lakes (supplying water to Mumbai ) will be put up on 1st June.
Pune: Warm/Hot, Partly cloudy and very windy.
New Delhi: Hot, very hot day around 44-46c. But relief as a thunder storm can lash the capital on 30th May.
Kolkata: Hot and humid around 38c...but again, thunder shower likely on 29th/30th to cool down the city.
Highest temperatures of Arabia and Sub Continent on 27th May...
1 Makkah (Saudi Arabia) 47.8°C
2 Bundi (India) 47.6°C
3 Churu (India) 47.5°C
4 Jacobabad (Pakistan) 47.5°C
5 Nawabshah (Pakistan) 47.5°C
North India Heat 27th May...Depicted by Navdeep Dahiya:

Gujarat: On Sunday 27th May, Kandla AP touched 46.3c. Gandinagar recorded 30.5c as the minimum.
Thursday, May 24, 2018

Posted 24th May Afternoon:
South West Monsoon Moves into Maldives....24th May
Hanimadhoo received 54 mms, Male 38 mms and Kahdhoo 18 mms.
South West Monsoon Current has also pushed into South Andamans...24th May
SWM advancing into Southern Sri Lanka by 25th May.... Galle got 76 mms, Ratnapura 68 mms and Colombo 56 mms till @4th Morning...

Tuesday, May 22, 2018
Posted 22nd Tuesday Night:
AS-2 is now Cyclone "Mekunu". Situated at 10.2N and 56.8E, it is likely to intensify into a severe cyclone. Will possibily cross the South Oman Coast around Salalah by 25th May. Severe winds and high seas likely around the strike regions.
UTH and OLR images suggest South West Monsoon advancing into Maldives and South Andaman by 24th May.
AS-3 could possibly form around 28th May (as it seems today) off the Karnataka Coast. This could be embedded in a strengthened off shore west coast trough. Then it is possible to create a gradient for SWM pull up after 30th/31st May along West Coast.
Predicted vagaries Monsoon advance over Kerala around 2nd June-4th June.
First Pre Monsoon drizzle possible in Mumbai on 29th ....
Karachi is facing severe heatwave conditions. The city has seen 44c as the maximum in the last 2 days, 20th and 21st May.
Highest in Pakistan was 47c at Chorr.
Detail below from Navdeep Dahiya

Sunday, May 20, 2018
Monsoon Watch --4 ...Quantum Analysis...20th May 2018
Quantum Analysis is evaluated for the amount of summer monsoon rainfall over Indian monsoon region during June- July....
Forecasting Methods adopted for the Indian Monsoons:
Gowarikar(1989) developed parametric and multiple power regression (MPR) models with 15 predictors for LRF of AISMR, which were later modified in 1991 to include 16 predictor parameters. The parametric model is qualitative and indicates the likelihood of the monsoon rainfall to be excess or deficient.
Thapliyal (1990) evaluated the relative performance of multiple regression, and Navone and Ceccatto (1994) have used 'feed-forward' neural network technique for the prediction of Indian monsoon rainfall with two predictors (500 hPa ridge location and Darwin SLP tendency from January to April).
The results of a recent work by Krishna Kumar (1997) indicate that a single component accounts for about half of the total variance in the predictors
Most of the studies on LRF of Indian monsoon rainfall were based on empirical or statistical techniques till 2010. IITM, Pune has recently implemented the state-of-the-art coupled climate model, the Coupled Forecasting System (CFS) developed by the National Centers for Environmental Prediction (NCEP), USA. These statistical techniques range from simple correlation analysis to advanced procedures.
Vagaries' View Point:
Vagaries leans on, and believes in the "Gowarikar Method" with 16 parameters. The results of this old but proven method has been successful. For Vagaries' forecast and analysis made in the "Arrival and quantum Monsoon Watch" series, I combine a few of them along with Dynamical models for a personal analysis and estimate.
15 initial parameters from the months March, April and May are used to analysis and forecast the simulation of Indian monsoon rainfall during June to October. These initial conditions were carefully selected to span the evolution of both the atmosphere and ocean.
We have to take into consideration most of the 15 parameters (Gowarikar Method) before making an assessment, and these have to be analysed one by one. The prominent among the 15 are , ENSO, March temperatures of North India and East Coast, Himalayan Snow cover till March and SOI to name a few.
Of-course, I am not going to take each and every one of the 15 here, but, derive at an estimate on these basis and on the new model developed. I hope readers of vagaries trust that I have tried my best to estimate as accurately as possible.
Calculating the amount of rainfall, region wise, is of utmost importance, as SWM contributes to almost 80% of the annual total rainfall over India.
In this article, Quantum Analysis is evaluated for the amount of summer monsoon rainfall over Indian monsoon region during June and July.
The 500 hpa parameter is of importance in April. The mean latitudinal location of the 500 hPa ridge along 75°E in April over India, first identified by Banerjee (1978), is considered to be one of the most important predictors. The mid-tropospheric anticyclone over southern India migrates from 11.5°N in January to its northern most position of 28.5°N during July.
From October, the ridge starts shifting back southward. A more Northward location indicates better performance of the monsoon and vice versa. It also showed that the negative correlation of the March ridge was more dominant with the monsoon rainfall of the peninsular India, while the positive correlation of the April ridge was more dominant with the monsoon rainfall of Northern India.
ENSO factor in arriving at the rainfall amount is also of importance. The interface is the sea surface: that is where the transfers of water (evaporation/precipitation)
and momentum occur. An accurate coupling of the fast atmosphere to the slow ocean is essential to simulate the ENSO, which in turn can simulate the interannual
variability of Indian monsoon. Unfortunately, getting an accurate, or near to accurate forecast of the ENSO for the next 2 months is difficult, with no guarantee of accuracy or performance surety.
Currently we see neutral ENSO conditions persisting. But, there is a possibility of Neutral event persisting till October. Now, this would result in normal Monsoon condition from June thru October.( "Break Monsoon" conditions apart).
After August, a 50-50 chance of neutral conditions continuing.
We depend also on other parameters.
Normally, Pulses from the Eastern Pacific area, that is S.China sea, would mean depressions and systems originating from the Bay. 'In Situ" systems and systems from the Far east would contribute to the rainfall to the east Coast thru Central India and into Gujarat and even into Sindh (Pakistan). No El-Nino, would mean no stopping these pulses, and in fact not encourage WDs into coming down south, (more South than normal).
This may persist till June, and then rapidly the flow of systems should increase from Bay in July.
The performance of Vagaries' Monsoon Watch Quantum Analysis is evaluated for the amount of summer monsoon rainfall over Indian monsoon region during June to SWM withdrawal in 2 phases. (June/July and August/September).
Why in 2 phases ? Because, I believe it is impossible to give actual Quantum forecast now (In May) for sometime in September...that is 120 days ahead !). I am not competent to give a forecast 90 - 120 days in advance,
so Monsoon forecast will be
1)...For June and July and
2)... August and September ..this is tentative and will be published in 2nd week July.
A) First 15 days of June 2018 sees
i) Monsoon advancing from Kerala thru upto Central India, and into NE States and West Bengal.
ii) Heat ( Normal to above Normal) in Northern India, and Pakistan.
Monsoon advances into Central India and North India between 20th - 30th June.
iii) Monsoon moves into Pakistan around 1st - 10th of July in phases.
B) Mid June to July end, we can see normal rainfall and progress of the SWM in all of Sub-Continent regions. Neutral conditions in the Pacific Oceans will send a few "pulses" to create "in situ" systems in the Bay, and the first 2 months could see around 3/4 noteworthy systems traversing the Sub continent. WDs will be few, hence, we can expect a few systems from Bay to track towards Central and Northern India, resulting in good rains in the plains of N.India and Northern Pakistan regions..and fairly good above normal rains in Nepal.
Slightly above normal rains likely along West Coast of India and A.P. coast and Odisha.
Weaker rains possible in June in Marathwada and parts of Telengana.
Thus, except for the above patch, June and July rains should be normal for the rest of the regions.
This estimate is based absolutely on the situation as it shows and stands today.
Things, if and when they change (drastically) will be posted and Vagaries readers will be kept well informed, of any variation in the forecast.
These are my personal views, and should not be depended upon commercially or otherwise. They may differ from other models.
Saturday, May 19, 2018
Posted 19th May Night:
South West Monsoon is advancing into the Southern Andaman Region. Monsoon will cover the South Andamans by 21st May.
A weak Low will bring strong South/South Westerly winds in the next 48 hrs in the South Bay region.
Day Temperatures on 19th May: Top 10 on 19th:
1 Chandrapur 47.8 °C
2 Bramhapuri 47.1 °C
3 Nagpur Sonegaon 46.2 °C
4 Wardha 45.6 °C
5 Khajuraho 45.0 °C
6 Khargone 45.0 °C
7 Sheopur 45.0 °C
8 Chittorgarh 44.9 °C
9 Akola 44.7 °C
10 Amraoti 44.6 °C

Monday, May 14, 2018
Posted 14th May Night"
Low pressure formed in the Arabian Sea will not have any effect on the Sub Continent Weather,
Somali Currents may strengthen to some extent.
As mentioned in Monsoon Watch -3 Part -2 (Additional), the estimated dates of arrival of Monsoon in India remains unchanged...
SWM should hit South Andaman Sea around 20th.May (12/15th May), and rest Andaman Islands by 23rd May 2018.
Generally moves up (normally) the Bay at a sustained speed, and Kolkata should see Monsoon arrival by the 14th of June.
Vagaries would estimate the Monsoon to reach Maldives around the 24th of May 2018 (20th May), Sri Lanka around 29th/30th of May (25th May).
Kerala by the 2nd/4th June (1st June)...
Hence, maintaining and presuming the normal rate of progress, As the Seasonal Low strengthens, Monsoon could "slide " up the coast to be in Goa should get Monsoon rains by around 8th/10th June (5th June).... NE States can also see Monsoon resume around that date.
Mumbai by 12th/14th June (9th June)..... Pre Monsoon thunder showers in Mumbai could start from around 4th/5th June 2018.
Friday, May 11, 2018
Kauai Experiences the U.S. 24-h Precipitation Record
The north shore of the Hawaiian island Kauai may have set a national record for the most rainfall ever in a 24-hour period, according to preliminary data. Rain gauges in Waipa, about a mile west of Hanalei, recorded 49.69 inches (1262 mms) on April 14 and 15.
Intense rainfall cut a path through Hanalei, which received 28 inches (713 mm) of rainfall. The U.S. Army and National Guard airlifted more than 220 people from the Haena and Wainiha areas after Kuhio Highway, the only road that leads to them, was blocked by landslides. Floodwaters carried off bison, some of which were rescued from the ocean. Ocean water around Kauai was an unusual shade of orange for a week after the storm because red–orange clay from the mountaintops was swept into the water by the rain.
The torrential rain began on April 12, when an elongated area of low pressure disrupted the normal flow of the northeast trade winds above Oahu. This caused heavy rainfall as the system strengthened and moved slowly over Kauai. The rain event lasted through April 19.
Kauai Experiences the U.S. 24-h Precipitation Record: ...Cliff Mass Weather Blog.
Heavy precipitation on Kauai was headline news two weeks ago, with flooding and substantial damage on the north side of that mountainous island.
But additional precipitation records have become available and it now appears that the precipitation in some locations went beyond extraordinary, producing 24-h amounts that have never been documented anywhere in the U.S. at any time: the all-time 24-h precipitation record of the United States.
That is something amazing.

This week the National Weather Service released a special statement that a rain gauge in Waipa, about a mile west of Hanalei, on the north side of Kauai, received 49.69 inches...1262 mms.... during the 24 hours ending 12:45 PM HST on Saturday April 15th (that is 2145 UTC/GMT). As an aside, the message was written by Kevin Kodama, the NWS Service Hydrologist in Honolulu, and a graduate of the UW Atmospheric Sciences department).

An official review team will evaluate the quality and consistency of the rain gauge data to determine whether the record was actually broken. This was not an official NOAA rain gauge but one installed by the Waipa Foundation. If true, the April 14-15th total would smash the previous U.S. 24-h record of 43 inches observed in Alvin, Texas on July 25-26, 1979.
Just stunning. A huge collection of lightning strikes over the northern and northeast side of Kauai (over 3000 of them).


Wednesday, May 09, 2018
Monsoon Watch -3... 2018 (Additional)...May 9th 2018.
Monsoon Arrival Dates Estimate.
The arrival date is calculated seeing today's position.Further from today, we presume the normal rate of progress/developments. This initial estimated dates are subject to some changes, and will be finalised later, when the puzzle pieces get better arranged.
(Dates in brackets are the normal dates of arrival).
As of today, there seems to be a slight delay in both, Arabian Sea and Bay Branches of the Monsoon. There continues to be a doubt on the timely arrival of the Monsoon in the Bay branch.
Arabian Sea Branch: The LWD parameter is not strong, and developed. Otherwise, There is not much improvement in some of the parameters, there is still much to be achieved, and most parameters are still lagging behind time, and are -ve.
The Arabian Sea branch, now affected by the "getting organised" Somali current winds and the equatorial winds at the equator. They can recover provided the winds regroup fast.
On these calculations, Vagaries would estimate the Monsoon to reach Maldives around the 24th of May 2018 (20th May), Sri Lanka around 29th/30th of May (25th May).
Kerala by the 2nd/4th June (1st June).
Hence, maintaining and presuming the normal rate of progress, As the Seasonal Low strengthens, Monsoon could "slide " up the coast to be in Goa should get Monsoon rains by around 8th/10th June (5th June). NE States can also see Monsoon resume around that date.
Mumbai by 12th/14th June (9th June). Pre Monsoon thunder showers could start from around 4th/5th June 2018.
Bay Branch: A weak Western Disturbance was active the Northern regions of the sub continent.Violent thunder Storms/Dust Storms ravaged through NW and North India due to inter action of WD and Eastern moist winds and of course the land heating.
North Temperatures have dropped in the last few days, considerably.(See Map below)Bay branch needs to wait a few days for the the pulses from the East in the Bay to resume for Low formations.
SWM should hit South Andaman Sea around 20th.May (12/15th May), and rest Andaman Islands by 23rd May 2018.
Generally moves up (normally) the Bay at a sustained speed, and Kolkata should see Monsoon arrival by the 14th of June.

We stop at this initial progress, and work out further region wise progress at a later date (as is the usual practise in Vagaries' MWs).
These Dates are worked out and estimated as per my personal calculations and may not be used for commercial purposes.The dates are not binding on anyone and no responsibility is taken if used for any purposes.
----------------------------------------------------------------------------------------------------End of MW-3 Part 2 (Additional)
--------------------------------------------------------------------------
Back to back Western Disturbances interacting with moist easterly winds and helped by high temperatures caused instability in the atmosphere in NW and North India. Resulting in violent thunderstorms/Dust storms.
Low temperatures recorded in North India (Minimum...as reproduced from Navdeep Dahiya
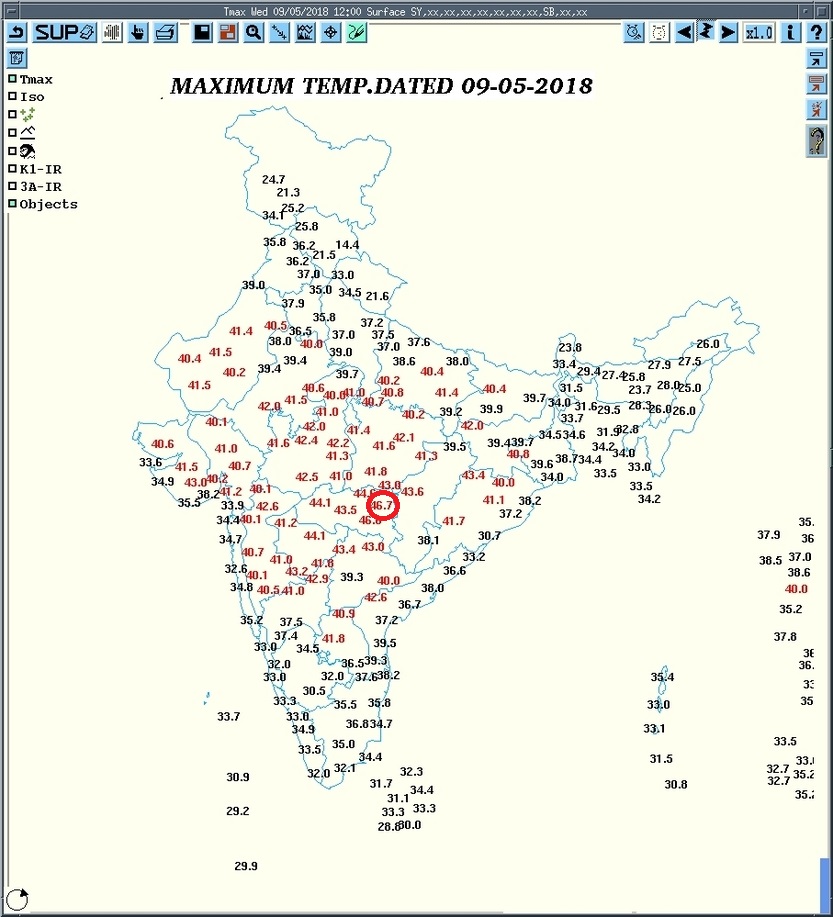
LOW MINIMUM TEMPERATURE IN PLAINS OF NORTH INDIA.
DATED: 9 MAY 2018
--------------------------------------
PUNJAB-
Balachar: 17.1°c
Hosiyarpur: 17.4°c Fatehgarhsahib: 18.2°c
Kapurthala: 18.2°c Tarn taran: 18.6°c
Jalandhar: 19.0°c Ludhiana: 19.3°c Amritsar: 19.6°c
Moga: 19.9°c Patiala: 20.1°c Bhatinda: 20.5°c
----------------------------------
Chandigarh: 20.0°c
----------------------------------
HARYANA-
Yamunanagar: 15.4°c
Ambala: 16.5°c
Kaithal: 16.6°c Panchkula: 17.2°c Karnal: 17.4°c
Kurukshetra: 17.4°c Narayangarh: 18.0° Sonipat: 18.2°c
Uchani: 18.5°c Panipat: 18.6°c Israna: 19.0°c
Fatehbad: 19.4°c Hisar: 20.1°c Rohtak: 20.7°c
Jhajjar: 21.0°c Faridabad: 21.8°c Gurgaon: 21.8°c
Ambala: 16.5°c
Kaithal: 16.6°c Panchkula: 17.2°c Karnal: 17.4°c
Kurukshetra: 17.4°c Narayangarh: 18.0° Sonipat: 18.2°c
Uchani: 18.5°c Panipat: 18.6°c Israna: 19.0°c
Fatehbad: 19.4°c Hisar: 20.1°c Rohtak: 20.7°c
Jhajjar: 21.0°c Faridabad: 21.8°c Gurgaon: 21.8°c
---------------------------------------
DELHI-
DELHI-
Pusa(iari): 19.0°c
Narela: 20.1°c Mungeshpur: 20.4°c
LodhiRoad: 21.0°c Jafarpur: 21.6°c Safdarjung: 22.4°c
---------------------------------------
NW-UTTARPRADESH-
Narela: 20.1°c Mungeshpur: 20.4°c
LodhiRoad: 21.0°c Jafarpur: 21.6°c Safdarjung: 22.4°c
---------------------------------------
NW-UTTARPRADESH-
Muzzafarnagar: 17.4°c
Meerut: 18.6°c Bareilly: 19.3°c
Hindon: 19.5°c Bahraich: 20.6°c Aligarh: 21.6°c
---------------------------------
RAJASTHAN- Siker: 20.0°c..Churu: 21.8°c
Meerut: 18.6°c Bareilly: 19.3°c
Hindon: 19.5°c Bahraich: 20.6°c Aligarh: 21.6°c
---------------------------------
RAJASTHAN- Siker: 20.0°c..Churu: 21.8°c
----------------------------------
Data: IMD
Data: IMD
Monday, May 07, 2018
Thursday, May 03, 2018
Monsoon Watch – 3 (Part 1)...2018 .....3rd May
Further Analysis of the parameters as discussed in MW-1,MW-2.
Further Analysis of the parameters as discussed in MW-1,MW-2.
Position as on 3rd May :
1.Cross Equatorial Winds :
Let me explain, that the winds on crossing the equator break into 2 branches. i) gushing into the Arabian Sea, and ii) moving into the Bay of Bengal.
Let me explain, that the winds on crossing the equator break into 2 branches. i) gushing into the Arabian Sea, and ii) moving into the Bay of Bengal.
wind flow on 3rd May 2018

i) In the Western sector Southern Hemisphere, winds are just picking up speed and hitting the East African coast, but no proper re-curving is seen. To get a defined Somali Current, we need a proper re-curving Northwards/North-East of the winds, on the Kenyan coast. The current SST off the Somali Coast is 26 c (above normal),while the required SST in first week of June is 19/20c. (Required to form masses of Monsoon clouds in the warm central Arabian Sea).
ii) In the eastern sector, in the Bay Branch, the cross equatorial winds are currently slightly haphazard and disorganised. In the Bay along India coast , the winds turn Southerly. The winds hitting Sumatra coast are not Westerly (as required), and also need to gather strength soon.
We prefer the Bay Branch to be better organised, as the normal date for SWM to hit the South Andaman Sea is 15th May.
Mascarene high pressure zone in the South Indian Ocean.
Main High reading of 1029 mb and other high of 1027 mb are currently observed between Madagascar and Australia.

The "Power House" of the Monsoon winds is lower in strength (should be 1032 mb), for this time of the season.
Indicator:-ve.
The NW plains heating picked up initially, and laxed again, as WDs started streaming in.
After the early summer onslaught,with 50c (Sindh Pakistan) in April itself, the heat decreased considerably over the North and west subcontinent after end April.
Over Northwest India, the max and min temps fell by 2-4c from the levels seen after MW-2 (averaging max 43-45 c).
Severe Duststorms and Thunderstorms lashed Punjab, Delhi and U.P. and parts of North Pakistan last week.
After recording first 50 c temp in April(30th) in Asia, Shaheed Benazirabad (Sindh) is currently at 45.5 c and Jacobabad 44.5c.
After recording first 50 c temp in April(30th) in Asia, Shaheed Benazirabad (Sindh) is currently at 45.5 c and Jacobabad 44.5c.
Karachi was 44.1c on 3rd May !
A Western Disturbance is approaching.....
Past 7 days anomaly -
An East-West Divide in Anomaly


Min temp was mostly in the normal range.
The seasonal Low, as a result has not shown good deepening, during MW 2 when it was 1002 mb
The pressure in the core region (Thar Desert / Sindh) is just touching 1000 mb mb. (In 2014 was 1004 mb, 2015 was 1000/1002 mb , 2016 it was at 1002 mb during this time).
As mentioned, it normally should reach a low nadir of 994 mb in June in the Thar Desert, and with 1008 mb in the South Arabian Sea, a perfect gradient is created to attract the south -west winds towards the coast.

The highest max temperature (46.0 c) over the subcontinent on 2nd May 2018 was recorded at Phalodi (Raj) and the highest min temperature (31.2 c) on 3rd May 2018 was recorded at Bikaner (Raj). Though in many Rajasthan towns, the minimum has dropped to 24-26c range. Ludhiana min was 18.8c (-3c below).
Indicator:-ve.
3. ENSO: This year also, like last year, we also base our observations on the Multivariate ENSO Index (MEI). An attempt is made to monitor ENSO by basing the Multivariate ENSO Index (MEI) on the six main observed variables over the tropical Pacific.
These six variables are: sea-level pressure (P), zonal (U) and meridional (V) components of the surface wind, sea surface temperature (S), surface air temperature (A), and total cloudiness fraction of the sky (C). (Negative values of the MEI represent the cold ENSO phase, a.k.a.La Niña, while positive MEI values represent the warm ENSO phase (El Niño).The MEI is computed separately for each of twelve sliding bi-monthly seasons (Dec/Jan, Jan/Feb,..., Nov/Dec).
Negative values of the MEI represent the cold ENSO phase, a.k.a.La Niña, while positive MEI values represent the warm ENSO phase (El Niño).
The updated (Feb-Mar) MEI is at -0.502 (in Jan-Feb was -0.731), for a slightly decreased ranking.
30 day SOI has fallen further after MW2 and is now at +3.0, while April 30th reading was +4.5.
90 day value is +4.4 ( sustained SOI of -7 to 7 is neutral. Above 7 is La Nina, and below -7 is El Nino ).
The Oceanic Nino Index (ONI) is based on SST departures from average in the Niño 3.4 region, and is a principal measure for monitoring, assessing, and predicting ENSO. ONI has remained same marginally after MW2 and latest value is -0.8 .
( ONI of -0.5 to 0.5 is neutral. Above 0.5 is El Nino, and below -0.5 is La Nina).

In the tropical Pacific, the El Niño–Southern Oscillation (ENSO) remains neutral—neither El Niño nor La Niña. All climate models indicate the tropical Pacific Ocean will continue to warm slowly, but temperatures will remain close to average through the Northern Summer Beneath the surface, the tropical Pacific Ocean is slightly warmer than average, but well within the neutral range...
Indicator: ENSO Neutral (should be watched for El Nino development in August/September).
4. The Bay had hosted a pre-monsoon low during March 2018.
As discussed, we should normally see a low sometime after the 15th of April.
As discussed, we should normally see a low sometime after the 15th of April.
But there has been no development after that. As on today, this region still maintains a luke warm response to the formation of a quick low. The pressure is anything but low, and currently a weak high ridge is observed.
What is needed now is a pulse from the Far East. But,currently there is no storm or low pressure in the Philippines’ Seas.
What is needed now is a pulse from the Far East. But,currently there is no storm or low pressure in the Philippines’ Seas.
A strong MJO would hasten the favourable formations and lows, with enhanced precipitation. The propagation of the MJO to the Indian ocean is uncertain over the next two weeks.
Another factor, which helps the winds gain strength, and bring more moisture into the Indian landmass, is the sea temperatures on both sides of the Peninsula. Optimum (warm) temperatures will hasten and create more clouds, and help in faster forming of the lows from the Bay.
Currently, the only sort of +ve sign is the above normal temps (30 c) of the seas surrounding the peninsula. But sea temps (29 c) near the South Andaman Sea have fallen below normal currently.
We prefer the Bay parameters to show fast progress, as the normal date for SWM to hit the South Andaman Sea is 15th May.
Sea Temp Anomaly

Indicator: -ve
5. ITCZ / LWD :
To bring the existing SE winds above the equator (as SW) , the ITCZ should move northwards.Currently it is near the equator. During late April , it oscillated between equator to 5N.
A LWD in the central peninsula region "looks after" the moisture content in the interior areas, and prepares the atmosphere with the humidity required. In reality, this LWD remains till June, in variable phases, and finally merges with the Monsoon trough (axis)/ITCZ when the ITCZ moves towards the Sub Continent.
Currently, the line of wind dis-continuity is located weakly as a trough, through the peninsula, from Interior Karnataka towards Kerala. It is giving adequate precipitation in the South peninsular regions. Outbreaks of pre- monsoon thunder showers which are expected normally in the southern states are taking place.

6.Jet Streams :
The 200 hpa Jet streams over the subcontinent is the additional parameter to be watched from MW-3 .
The jet streams are to be followed as the westerly jet core shifts to the north and easterly jet stream is formed, over the course of late summer, progressively from south to north of the subcontinent , heralding the progress of south-west monsoon over the subcontinent.
Currently are getting into the easterly trend, south of 10 N latitude.
They are required to strengthen to easterlies at those latitudes in the coming days, for heralding the SWM to the South Andaman Sea.

The westerly jet core shifts north of the Himalayas during the southwest monsoon season, as the jet streams turn easterly over the subcontinent.
Indicator: Normal
So, overall, we can summarize as:
Parameter: MW-1: 1) -ve 2) -ve 3) Neutral 4) -ve
MW-2: 1) -ve 2) -ve 3) Neutral 4) -ve 5) Normal
MW-3: 1) -ve 2) -ve 3) Neutral 4) -ve 5) Normal 6) Normal
*But, situations can change fast, and by the time we discuss the next MW, some factors can suddenly become +ve or -ve. So, MW discusses and follows the developments as they emerge, and discuss the parameters as is where are.
Monsoon Watch should not be used/depended upon commercially or otherwise. Monsoon Watch Series may differ from other models.)
Looking at the current parameters, there seems slight delay in the South West Monsoon arrival dates for Andaman and Kerala as of now.
Looking at the current parameters, there seems slight delay in the South West Monsoon arrival dates for Andaman and Kerala as of now.
But would like to wait for another 4 days to see any changes in parameters, so MW-3 Part 2 will be published 7th May (Brief write up with estimated dates of SWM arrival).
The quantum of rainfall expected will be analysed in the subsequent MW-4, which will be ready for publication on 16th May.
The quantum of rainfall expected will be analysed in the subsequent MW-4, which will be ready for publication on 16th May.
Subscribe to:
Posts (Atom)
Vagaries Weather Outlook for Weekend - 9th/10th May :
9th May Night Post 👇 No Warnings... All Temperatures in +_ 1° of normal range. Mumbai : Hot and humid.. Making Real Feel of 39°.. Day: ...

-
 Short Narration: Monday 1st/Tuesday 2nd : The heaviest rains are in Madhya Maharashtra, Marathwada, North Interior Karnataka and No...
 -
 Much Awaited Monsoon Analysis to Date from ..None Other than Our GSB..on "Stats and Analysis" Page..Just Recieved On Saturday ...
