The massive winter storm set to begin tomorrow will stretch 2,000 miles across the country, from the Arizona-New Mexico border to upstate New York. All major metros from Dallas to New York City are in the storm's path.
At least a dozen states have declared states of emergency.
The storm will start in Texas and Oklahoma, with treacherous conditions after sunset. On Saturday, wintry precipitation will stretch from central New Mexico into central Virginia. By Sunday, heavy snow will push into the Northeast, including New York City and Boston, as icing continues over parts of the mid-Atlantic. The storm will end Monday afternoon.
The National Weather Service said today that 132 million people are under alerts for snow, sleet and freezing rain.
Wind chills of 40 to 50 below zero are possible in the Upper Midwest and the Great Lakes region. In Texas and other Gulf Coast states, temperatures could feel like the single digits to minus 10 degrees Fahrenheit.
8th h January 2026
Almost 80% of Europe’s surface is currently covered by snow. This is the largest extent in recent years — see the comparison from our European snow cover archive since 2018. 📉 The snow cover was significantly more extensive only in 2010 and 2009, while a similar extent was recorded in 2017. In the context of the last 20 years, the current snow cover therefore ranks around fourth:
Meanwhile less snow as yet over The Himalayan Range.
-------------------------- 4th January..2026
Vagaries of the Weather:
Scorching Heatwave Hits Australia, While US Freezes Like Refrigerator: This is What You Need To Know How Weather Punishing Travel and Tourism Hard...
Scorching Heatwave Hits Australia While US Freezes Like Refrigerator This is What You Need To Know How Weather Punishing Travel and Tourism HardThe scorching heatwave currently hitting Australia is breaking records, with temperatures soaring well above 40°C, making outdoor activities nearly impossible. Meanwhile, in the US, freezing temperatures are sweeping through cities, leaving travelers in a state of shock as the country faces bone-chilling cold. Scorching heatwaves in Australia and the frigid cold in the USA are having a significant impact on travel and tourism, punishing tourists and operators alike. As Australia’s heatwave intensifies and the US freezes like a refrigerator, the effects on tourism become more evident. Read on to discover the full story!
Australia’s Scorching Heatwave: A Tale of Extreme Heat Over Major Cities
Australia is currently battling an intense heatwave with scorching temperatures breaking records across multiple states. From Adelaide to Kalgoorlie, the blistering heat is affecting millions of Australians as thermometers soar well above 40°C in many parts. Official reports from the Bureau of Meteorology warn of dangerous heat that will persist throughout the week. This brutal heatwave is sweeping through Western Australia, South Australia, Victoria, and New South Wales, bringing temperatures above 45°C. These heat extremes not only make outdoor activities unbearable but also raise serious concerns about public safety, including heatstroke, dehydration, and heat stress. Major cities like Adelaide are predicted to experience highs of 41°C, with other towns such as Kalgoorlie expecting 44°C. This heatwave could become one of the longest and hottest on record.
USA: Arctic Cold: Cities Freezing Under an Ice-Cold GripWhile Australia is battlingrecord-breaking heat, theUnited Statesis suffering from its own extreme weather, asbitterly cold airsweeps through the nation. In a stark contrast to thescorching temperaturesdown under, theUSA is facing Arctic blaststhat are sending temperatures plummeting tosub-zero levels.CitieslikeChicago,Minneapolis,Buffalo, andNew Yorkare enduring temperatures as low as‑22°C, with wind chills making it feel much colder. Thesefreezing conditionsare the result ofpolar vortex disruptionsthat allow frigid air from the Arctic to sink into theMidwest,Northeast, andUpper Midwest. Areas likeNorth DakotaandWisconsinare bracing fordangerous wind chills, which could make it feel like‑48°Cin some places.
The polar vortex is to blame for frigid conditions in the USA, while Australia’s heatwave is driven by high-pressure systems pushing hot air from the desert interior to the coasts. While the USA shivers through one of its coldest winters, Australia faces life-threatening heat. Such extreme weather patterns in both hemispheres are causing headaches for forecasters who continue to track the polar air flow and heat dome patterns that are growing increasingly erratic.
Israel Weather Extremes in 2025
22nd December
When the desert turned white: Saudi Arabia sees snowfall as rare cold wave sweeps the Kingdom
Saudi Arabia, typically known for its scorching heat and expansive deserts, recently witnessed an unexpected winter event as heavy snowfall, rain, and a sharp drop in temperatures swept through much of the country. This rare weather phenomenon both thrilled and concerned locals. The event was another stark reminder of how climate change is contributing to increasingly unpredictable weather in regions unprepared for such extremes.
Northern Saudi Arabia saw snowfall that dramatically transformed the landscape of the Tabuk Province mountains. Trojena, a high-altitude area on Jebel Al-Lawz, located at 2,600 meters above sea level, was blanketed in snow, while light rain also fell in the region. Snow was also recorded in parts of the Hail Region, including around Hail city, which is an extraordinary occurrence for the usually arid Middle East. During the early morning hours, temperatures dipped below freezing in certain areas, creating ideal conditions for snow to accumulate in the higher altitudes.
In addition to the snow, rain was widespread, affecting several regions. Bir Bin Hermas, Al-Ayinah, Ammar, AlUla Governorate, Shaqra, and its neighboring areas experienced light to moderate rainfall. Riyadh, Qassim, and the Eastern Region saw more intense rain, with some areas reporting heavy downpours. The National Centre for Meteorology (NCM) confirmed that snowfall was also recorded in Al-Majmaah and Al-Ghat, located north of Riyadh, where snow accumulated on open fields and elevated terrains.
15th December 2025
Polar Vortex blankets eastern US with dangerous arctic air as nearly two dozen states feel extreme blast
NEW YORK — The coldest air of the early winter season is blasting the eastern U.S. with single-digit temperatures with the wind chill, as the Polar Vortex unravels and with it, brings dangerous arctic air to millions from New England to the Gulf Coast
More than 70 million Americans were under Cold Weather Alerts for Monday, in what the FOX Forecast Center said could end up being the coldest day of the year when considering wind chills.
Wind chill temperatures were in the single-digits and teens across the Midwest and Northeast on Monday morning.
Atlanta and Birmingham, Alabama have also activated warming centers through the first half of the workweek.
Chicago winter could be coldest, snowiest in years thanks to weather phenomenon called "The Blob"
By David Yeomans
/ CBS Chicago
Twenty-three nights with temperatures below zero, and snow falling every other day for months; many Chicagoans remember the winter of 2013-2014 as a long and difficult one.
And there is one reason why this winter could be similar – a massive area of record-warm ocean water thousands of miles away called "The Blob."
"The Blob," also called a "warm blob," is a marine heatwave featuring much warmer than normal ocean temperatures for an extended period that can have major impacts on animals, economies, and weather patterns. A recent study found that enhanced warming in the Arctic from climate change is linked to these marine heatwaves.
Since the ocean and atmosphere work in concert with one another, record warm ocean temperatures on such a large scale have a big impact on global weather patterns.
A warm blob over the North Pacific often corresponds with a large area of high pressure, or a bump northward in the jet stream. Since the atmosphere likes equilibrium, where there is a large ridge, a large dip in the jet stream, or trough, often follows. This trailing dip in the jet stream during a warm blob event typically bisects the U.S., driving outbreaks of Arctic air and massive snowfall events into the Chicago area and Upper Midwest.
This is what led to Chicago's third-coldest winter on record in 2013-2014, with temperatures from December through February averaging a frigid 18.8 degrees Fahrenheit. The typical average is 27.7 degrees. February temperatures alone were more than 11 degrees below normal.
From Dec. 1, 2013 through Feb, 10, 2014, snow fell in Chicago nearly every other day —– something the Romeoville National Weather Service Office called "astonishing regularity." Nearly three feet of snow fell in January, and winter totals reached 67.4 inches. An average winter brings 29.6 inches.
There was at least one inch of snow on the ground at Chicago O'Hare from Jan. 18 through Mar. 10, a 52-day streak and the city's 11th-longest on record. Nearby Rockford had what the National Weather Service called an "incredible streak of snow cover" lasting 93 days from Dec. 9 through Mar. 11, their third-longest on record.
La Niña conditions in place as of October also favor a Great Lakes storm track and can lead to colder, snowier winters in Chicago. In addition to similar warm blob conditions, the current weak La Niña phase also mirrors what we saw heading into winter 2013-2014.
Though less significant warm blob events were observed in the winters of 1990-1991, 2004-2005, 2010-2011 and 2021-2022, the only other times the warm blob coincided with a La Niña pattern were in 2010-2011 and 2021-2022. The winter of 2010-2011, featuring a strong La Niña, was Chicago's 10th-snowiest on record with 56.3 inches of snow. The winter of 2021-2022, with a moderate La Niña, featured near-normal snowfall of 28.6 inches.
While the significant warm blob event tilts Chicago's odds toward a snowier than normal winter to come, other factors could influence how much snow the city receives.
31st August 2025
An oblique photo from the International Space Station captured haze spilling from valleys in Italy and France and streaming south along the Italian peninsula.
Image of the Day for August 31, 2025
6th July...2025
Why is it so cold in Argentina, Chile, and Uruguay?
A historic cold snap has swept across the Southern Cone of South America, bringing record-low temperatures, snowfall in unexpected places, and at least 15 reported deaths. The polar air mass — originating from Antarctica — has disrupted daily life in Argentina, Chile, and Uruguay, forcing emergency measures like gas rationing and shelter activation. Here’s what you need to know about the cold wave and why it’s happening.
What exactly is happening?
A powerful polar air mass escaped from Antarctica and moved northward, plunging temperatures across southern South America. Cities unaccustomed to such cold are now experiencing record-breaking lows, snowfall, and energy disruptions.
Which areas are worst affected?
Argentina: Buenos Aires hit -1.9°C, its coldest since 1991. Snow fell in Miramar for the first time in 34 years. Maquinchao in the south recorded -18°C.
Uruguay: The capital Montevideo saw its lowest daytime high since 1967 at 5.8°C
Chile: Chillan, south of Santiago, hit -9.3°C. Snow even fell in the Atacama Desert, the driest place on Earth.
4th July..2025
27th April ..2025
The temperature in southern England could hit 27C (81F) later this week making it the highest temperature recorded in April since 2018.
Warmth and sunshine will develop widely across most areas of the UK as high pressure gradually builds.
Lack of rainfall however, will again raise concerns about potential wildfires.
The last time the temperature rose to 27C in April was in 2018 in Cambridge.
How widespread will the warmth be?
Runners of the London and Manchester marathons will likely tell you that it was already warm on Sunday, with the those pounding the streets of the capital experiencing the fourth-warmest London Marathon in its history.
The week begins with temperatures across England and Wales already hitting 19-24C, with much of Scotland and Northern Ireland around 16-19C under slightly cloudier conditions. Some patchy rain likely in north-west Scotland, too.
However, as sunny skies develop more widely, the combination of strong sunshine and light winds will help temperatures to peak on either Wednesday or Thursday, and be the highest of the year so far in each of the four nations.
23C is the expected high in parts of Scotland and Northern Ireland, 25C in Wales and 27C in England.
London, the Home Counties and Cambridgeshire are the areas expected to record the warmest of the conditions.
With sea temperatures around the UK still relatively low at the moment, coastal areas where sea breezes develop will feel cooler, but UV levels will remain high.
Is this a heatwave?
Whilst the upcoming spell of warmth is significant, with a number of areas seeing temperatures 10 degrees above what we'd usually expect, it is not technically going to be a heatwave in meteorological terms.
For this, we would need to see at least three consecutive days at or above the "heatwave threshold" which varies depending on where you are in the UK.
Do be prepared for high levels of UV, as the sun is as strong this time of year as it is in August.
If you're a hay fever sufferer, another feature of the warm and sunny weather will be an increase in pollen levels.
How unsual is the warmth?
While this will be the warmest weather of the year so far and the warmest since early September, April can bring big swings in temperature and it is not unusual to see this type of hot spell during spring.
The highest April temperature ever recorded is 29.4C which was reached in London on 16 April 1949.
As our climate continues to warm though, we expect this type of spring heat to occur more often. Recent analysis found that spring is the fastest-warming season in the United Kingdom.
BBC Report ---------------------------------------------------
---------------------------------------
25TH JAN 2025
CHICAGO CHILL
Between January 19 and 24, 2025, a brutal cold snap hit Chicago. This satellite image captured a glimpse of the wintry aftermath.
The first half of the cold spell saw the chilliest weather, according to the National Weather Service (NWS). On January 21, the air temperature in Chicago reached as low as minus 15 degrees Fahrenheit (minus 26 degrees Celsius). At the time, little to no snow covered the ground in Chicago, which NWS noted is uncommon amid sub-zero temperatures.
Snowflakes returned toward the end of the cold spell. Between the mornings of January 22 and 23, several waves of snowfall produced the blanket of white across the Chicago area visible in this image, acquired on January 24, 2025, with the OLI (Operational Land Imager) on Landsat 8.
Another expanse of white is visible atop Lake Michigan. This is lake ice, which grows on the Great Lakes each winter, though its extent and timing can be highly variable. Ice coverage on the Great Lakes typically reaches its annual peak in late February or early March.
On January 24, winds were blowing offshore and pushing ice away from the coastline, according to Jia Wang, an ice climatologist at NOAA’s Great Lakes Environmental Research Laboratory (GLERL). Areas of thin (dark) ice closer to shore transition into patchy areas of bright white ice away from shore. Wang thinks these whiter areas might be due to ice that has piled up and formed a very rough surface.
The area of Lake Michigan covered with ice in late January 2025 hovered around the historical average (1973-2024) for the time of year, according to data from GLERL. When the image was acquired, ice covered about 20 percent of the lake.
Meanwhile, several hundred miles to the east, ice on Lake Erie spiked well above average in late January, according to GLERL, with ice spanning around 80 percent of the lake. The ice was thick enough to temporarily immobilize a Canadian cargo freighter, according to news reports.
Scientists are currently investigating ways to use altimetry data from NASA’s ICESat-2 (Ice, Cloud and land Elevation Satellite-2) to determine the thickness of ice on the Great Lakes. According to Eric Anderson, a researcher at the Colorado School of Mines, such measurements could improve ice and weather forecasting as well as help us understand changes in Earth’s surface freshwater.
NASA Earth Observatory image by Michala Garrison, using Landsat data from the U.S. Geological Survey. Story by Kathryn Hansen.
6TH Jan 2025:
U.S:Massive Winter Storms and Snow and Cold not seen in Decades
Conditions will deteriorate over Western Europe again over the weekend as a violent North Atlantic storm is forecast to impact Ireland and the UK.
Major weather change forecast for Europe; progressive winter pattern develops
A large upper-level trough will establish over the European continent by mid-week, dominating the weather pattern. If we remember the first half of November, Europe was under an extensive Omega blocking High; it will now be a completely flipped pattern.
Quite some snow is also forecast across parts of the UK and Ireland earlier on Tuesday and Wednesday. Associated with a rapidly organizing winter storm under the strengthening cold lobe aloft, at least northern England and Scotland will see some decent amount of snow.
Heavy snow will be possible, though the amount of snow that accumulates strongly depends on the position of the low on Tuesday
16th September 2024
Canberra shivers through coldest September morning ever as south-east Australia records freezing temperatures
Capital’s weather falls to -6.9C on Monday while parts of inland NSW drop below zero and SA town has coldest September morning in more than 62 years.
Much of Australia’s south-east shivered through freezing temperatures overnight, with another frosty morning forecast for Tuesday before temperatures warm back up.
Canberra marked its coldest September morning on record, reaching -6.9C on Monday. The previous September record of -6.8C was set 12 years ago in 2012.
Monday’s temperature was the coldest morning for Canberra in general since last June.
The hills surrounding Canberra also saw snowfall at the weekend.
Widespread parts of inland New South Wales faced some of the coldest temperatures across the country on Monday morning, with a number of locations at or below zero degrees.
Cooma had the lowest overnight temperature across Australia, according to Dean Narramore, a senior meteorologist at the Bureau of Meteorology, with a low of -8.2C. Further north, Goulburn reached -6C, Young hit -5.3C, Bathurst -3.9C and Wagga -3.4C.
According to Weatherzone, this was Wagga’s coldest September minimum in 58 years. Additionally, Keith in South Australia reached -4.5C, its coldest September morning in more than 62 years.
Victoria’s alpine areas were the hardest hit by the frosty overnight temperatures, with Mount Hotham recording -6.5C. But even further away from the alps, Omeo saw -4.5C and Rutherglen reached -4C.
Walpeup in the Mallee region saw a low of -1.2C, Weatherzone reported, its coldest temperature in 29 years.
9th September 2024
US weather: Arctic chill to bring snow as temperatures hit ‘record lows’
The ‘first chill of winter’ will bring snow to parts of the US as bitter winds spill in from the Arctic.
Temperatures across Colorado, Utah, Idaho, Oregon, Washington, Montana and surrounding states this week could hit ‘record lows’.Snow has already hit the Colorado mountains, with more on the way through the start of autumn.
Weather Channel meteorologist Danielle Banks said: “Some snow has already been spotted in the Colorado Rockies, which is not uncommon.
“Parts of the highest elevations of the Rockies in Colorado were dusted with light snow, including Berthoud Pass west of Denver and Pikes Peak west of Colorado Springs.
“On average, some locations in western Montana, Wyoming and Colorado see their first measurable snow of the season in September.”
Thermometers across the north and Midwest through the coming days could dip close to freezing.
From GB..News
24th August 2024
Unusual weather leads to summer snowfall in western mountains of US
This photo from the National Weather Service shows a snow-covered section of Mt. Rainier, Washington, at 10,000 feet, Aug. 24, 2024.
YOSEMITE NATIONAL PARK, California —
An unusually cold weather system from the Gulf of Alaska interrupted summer along the West Coast of the United States on Saturday, bringing snow to Washington state's Mount Rainier and a lookout point of California's Sierra Nevada.
Photos posted by the National Weather Service and local authorities showed a white-covered peak from Rainier and a dusting of snow at Minaret Vista, a lookout point southeast of Yosemite National Park in California's Sierra Nevada.
Madera County Deputy Sheriff Larry Rich said it was "definitely unexpected" to see snow at Minaret Vista in August.
"It's not every day you get to spend your birthday surrounded by a winter wonderland in the middle of summer," he said in a statement. "It made for a day I won't soon forget, and a unique reminder of why I love serving in this area. It's just one of those moments that makes working up here so special."
Snow also fell overnight on Mammoth Mountain, a ski destination in California, with the National Weather Service warning hikers and campers to prepare for slick roads.
More light snow was possible in California on the crest of the Sierra Nevada, mostly around Tioga Pass and higher elevations of Yosemite National Park, the National Weather Service said.
A group of cross country athletes, who had traveled from Davis, California, huddle after their practice was canceled due to wet and snowy conditions in Donner Summit, California, Aug. 22nd August 2024:California will see first August snow in 20 years as freak cold snap brings abrupt end to summer -
August snow has not occurred in those locations since 2003, forecasters said.
Tioga Pass rises to more than 9,900 feet (3,017 meters) and serves as the eastern entryway to Yosemite. But it is usually closed much of each year by winter snow that can take one or two months to clear.
"While this snow will not stay around very long, roads near Tioga Pass could be slick and any campers and hikers should prepare for winter conditions," the weather service wrote.
While the start of ski season is at least several months away, the hint of winter was welcomed by resorts.
"It's a cool and blustery August day here at Palisades Tahoe, as a storm that could bring our first snowfall of the season moves in this afternoon!" the resort said in a social media post Friday.
The "anomalous cool conditions" will spread over much of the western U.S. by Sunday morning, according to the National Weather Service's Weather Prediction Center in College Park, Maryland.
Parts of California are expected to see bits of snowfall this weekend, which would mark the first time in 20 years the state has welcomed the white stuff in August, but it won't last long.
Four areas in the high Sierra Nevada - Tioga Pass, Tuolumne Meadows, Vogelsang, and Wwolf - could see snow between Friday morning and Monday afternoon, according to the National Weather Service (NWS) in Hanford.
An 'unusually, early cold storm' is expected to pass through, causing those in higher elevations to see the first August snowfall in at least two decades. Amounts could reach over half an inch.
NWS suggests travelers alter plans if necessary, especially those above 8,000 feet, as Tioga Road 'may become slippery before snow melts' and 'visibility may be greatly reduced.'
Four areas in the High Sierra - Tioga Pass, Tuolumne Meadows, Vogelsang, and Wwolf - could see some snowfall between Friday morning and Monday afternoon
An 'unusually, early cold storm' will be passing through, which will cause those in higher elevations to see it's the first August snow in 20 years that would amount to over half-an-inch
On July 21, the Thredbo ski resort reported that 59 centimeters (23 inches) of snow had fallen during the storm. Smaller accumulations came in subsequent days. Starting July 28, a strong cold front delivered “unusually low” temperatures to parts of New South Wales and yet more snow to the mountains. According to news reports, some of Australia’s extreme winter weather in 2024 was influenced by a rare sudden stratospheric warming event over the Antarctic
‘Magical wintry scenes’: snow ‘just keeps coming’ at Australian ski resorts
A massive dump of snow on Friday night has continued into Saturday, bringing ‘super thick fresh powder snow’ to alpine areas
“It’s been brilliant, it started snowing on Friday night and hasn’t stopped,” he said. “Now’s the time to come – it’s the best conditions we’ve seen so far.”
The resort town received 22cm of snow on Saturday morning, with an additional 15cm accumulating throughout the day – and more forecast.
Mount Hotham received 31cm of snowfall in the 24 hours to Saturday morning, with the resort at full capacity and closed to day visitors. Further north, Thredbo was blanketed in 27cm of snow overnight, taking its seven-day snowfall count to 43cm.
“The entire mountain and village have been covered in a thick blanket of fresh white snow, creating magical wintry scenes,” a spokesperson said.
“The snowstorm rolled in yesterday evening, bringing heavy snowfall, blizzard conditions and strong winds.
“Experts forecast that this low-pressure system could bring another 50cm over the next 10 days.”
Falls Creek in north-east Victoria received 45cm of snowfall in 24 hours, including 33cm of fresh snow on Friday evening. Photograph: Aidan Haynes/Falls Creek Resort
U.S. Heats up ..6th July 2024👇
Hottest Spots in the World on 6th July...👇
Death Valley holds the World Record Hottest Temperature of 134° set July 10th, 1913. This is the official record.
Let us see the Coldest Spots today also,👇
30th April 2024
Manila, the megalopolis metro area of over 14 million people in the Philippines, set an all-time high of 101.8 degrees Fahrenheit (38.8 Celsius) Saturday. It also witnessed its hottest night on record last Wednesday with a low of 85.6 degrees (29.8 C).
Philippines: Manila set multiple major heat records. Sangley Point, on Manila Bay, also observed a low of 86.4 degrees (30.2 C), the hottest overnight minimum in the country’s history.
16th April 2024
U.A.E, Oman and Dubai bear the brunt of a severe W.D. system.
New Thunderstorm cells form back to back when all conditions are favorable.. You have little time to do seeding ( even done it will benefit another by little margin that also 50-100km away.
Strong winds and torrential downpours were reported in Abu Dhabi, Dubai, Sharjah and Ajman, while videos of golfball-sized hail in Ras Al Khaimah, Al Ain and parts of the UAE capital also circulated online. (Gazia Mag).
Sometimes when big thunderstorm cluster forms and moves over regions where there are good conditions for more TS to develop, this process can sustain.
TS downdraft gust can help generate new convection on the downwind side...so that helps in continuing this cycle for longer time.
It has been observed in the past around mid May or May-end. Not common for mid April for west coast.
Such long sustaining TS have been observed over the east coast, when strong Kalbaisakhis sustain very long, and move north to south along the east coast, often reaching Chennai or south AP from around Odisha.
Hot winds known as the “calima” brought an intrusion of dust from the Sahara Desert to Portugal and Spain in late March 2024. Suspended particles reached the region on March 21, coloring skies orange and degrading air quality for several days.
The MODIS (Moderate Resolution Imaging Spectroradiometer) on NASA’s Terra satellite captured this image of dust enveloping the Iberian Peninsula on March 22. On that day, snowy slopes at a ski resort near Granada were tinged with brown from dust deposition and other areas saw “muddy” rain, according to news reports.
9th March 2024
Met Office warns over ‘once in 250-year’ weather event taking place over UK
A once-in-a-250-year weatherevent is underway across theUKthat could bring bitter wintry conditions across swathes of the country, the Met Office has said.
A Sudden Stratospheric Warming event, which is associated with very cold weather and brought the Beast from the East in 2018, usually hits the UK every other year.
But the Met Office says that this extended winter period, from November last year to March, is the first time three SSW events have been recorded since records began.
An SSW is a disruption of the normal westerly airflow 10 to 50 km above the Earth. This often makes the jet stream meander more, which can lead to the development of a large area of high pressure over northern Europe at the Earth’s surface.
This can ‘block’ the Atlantic low-pressure systems which are responsible for the relatively mild, wet and windy weather that often occurs in UK winters, the forecaster says. This blocking pattern increases the chance of cold, dry weather in the UK and miProfessor Adam Scaife, head of long-range forecasting at the Met Office, said: “Although we have not seen it before, we recently documented the chances of an unprecedented three SSW events happening in one winter.
“Our research work, using multiple computer simulations, showed that this could occur about once in every 250 winters.”ld, wet and windy conditions for southern Europe.
Although the event does not always lead temperatures to plummet, 70 per cent of SSW occurrences are linked to a cold snap.
Professor Scaife added: “Although this is very rare, we also found that the chance of multiple SSW events is increased... and so the chance of multiple events this winter is raised.”
The chaos-inducing ‘Beast From the East’ snowstorm of March 2018 was caused by this process, which saw heavy snow, ice and strong winds that caused 17 fatalities and brought the country to a standstill.
The good news is that the interval of several weeks between an SSW taking place and its beginning to impact our weather is long enough that it can be reliably tracked with satellites.
The str---ongest jet stream ever observed by a radiosonde? 259 mph ( 416.8 Kmph) near Yanongo Japan in 2004.
18th February ..2024 :So how unusual were the winds, say over Washington, DC during this event?
There is a radiosonde (balloon-launched weather station) at Sterling, Virginia (Dulles Airport), just to the west of Washington, DC. On Sunday morning, the ballow measured a speed of 218 knots from the west.
Impressive. But how unusual? Below is a plot (red line) of the daily 250-hPa (about 33,000 ft) strongest winds at that location for a period from 1950 to today. The star indicates the Dulles winds on Sunday.
That morning, there were the second strongest winds at that level in over 70 years! That is very, very impressive.
Map showing temperature departures from average via a computer model run on Feb. 19. Image: Weatherbell.com
Extraordinary winter warmth has struck Japan in recent days, with hundreds of monthly high temperature records for February broken by rare margins.
Why it matters: The heat wave occurs as other unprecedented hot streaks are being felt elsewhere, from the U.S. to South America.
The big picture: The monthly high temperature records shocked forecasters in Japan and weather record trackers elsewhere.
Maximiliano Herrera, who keeps tabs on global weather records via social media, has been increasingly struggling to come up with new superlatives to describe extreme weather events. He called the heat wave's intensity "madness" in a post on X.
According to his data, more than 480 temperature records fell in three days, with the old monthly records broken by more than than 6°C (10.8°F) in some cases.
"This is the most extreme event in 150 years of Japanese climatic history," Herrera stated.
By the numbers: According to NHK meteorologist Sayaka Mori, 337 high temperature records were broken nationwide during three days, with many of them counting as new monthly highs.
For example, at Tokyo Haneda Airport on Feb. 19, the high temperature hit 73°F (22.6°C) which was 11.8°C (21.24°F) above average for the date, and a monthly record, Mori stated on X.
Mori wrote that on Monday, a "shocking" 216 February temperature records were broken in the country, noting that three of these locations have kept weather data since the 1880s.
In addition, she said, snow depth plummeted to zero at observing sites in Akita, which typically sees heavy snow during the winter.
Between the lines: The unusually mild weather in Japan has disrupted the typical seasonal activities in snowy and cold northern Japan.
According to Kyodo News, the Kamakura snow hut festival in Yokote was disrupted by rainy conditions and temperatures that climbed well above freezing.
"This is unprecedented. I hope people don't think this is what Kamakura is supposed to look like," Katsuo Kitajima, a craftsman, told the news organization.
How it works: The proximate cause of the winter warmth was a broad, strong area of high pressure at mid-and-upper levels of the atmosphere and a high pressure area parked to the southeast of Japan.
The circulation around this high drew warm air from the southwest northward. A colder weather pattern has now returned.
Numerous studies show that as the planet warms overall, the chances and severity of heat waves — including winter warm spells — are increasing.
Some recent studies have even found that heat waves would have been "virtually impossible" without human-caused climate change.
The intrigue: The record warmth in Japan matches trends seen in other parts of the world since 2024 began.
These are likely tied to a strong El Niño event in the tropical Pacific, human-caused global warming, and natural variability, including perturbations in the jet stream that steers weather systems.
Strong El Nino Conditions Prevails At The End Of January 2024 – However This El Nino Not Expected To Be Stronger Than 1982-83 Or 1997-98 Or 2015-16 El Nino
Strong El Nino Conditions Prevails At The End Of January 2024 – However This El Nino Not Expected To Be Stronger Than 1982-83 Or 1997-98 Or 2015-16 El Nino
Enso Status on 10th February 2024
The classification of El Niño events, including the strength labels, is somewhat subjective and can vary among meteorological and climate agencies. There isn’t a strict rule defining the specific number of consecutive Oceanic Niño Index (ONI) values that must be 2.0°C or above to categorize an El Niño event as “Super Strong.”
In general, a strong El Niño event is often characterized by ONI values reaching or exceeding +2.0°C. A Super Strong El Niño would typically involve sustained ONI value of +2.0°C or more. Hence for ease of understanding and comparing the strength of various Strong El Nino events, I propose to define an El Nino as a Super Strong event if three consecutive ONI index is +2.0°C or more.
A brief history of the past El Nino events with the number of consecutive ONI +2.0°C or above:
In the year 1965 the highest ONI index during that El Nino were SON +2.0°C, OND +2.0°C
In the year 1972-73 the highest ONI index during that El Nino were OND +2.1°C NDJ +2.1°C DJF
In the year 1982-83 the highest ONI index during that El Nino were SON +2.0°C, OND +2.2°C NDJ +2.2°C DJF +2.2°C
In the year 1997-98 the highest ONI index during that El Nino were ASO +2.1°C SON +2.3°C, OND +2.4°C NDJ +2.4°C DJF +2.2°C
In the year 2015-16 the highest ONI index during that El Nino were ASO +2.2°C SON +2.4°C, OND +2.6°C NDJ +2.6°C DJF +2.5°C JFM +2.1°C
ONI Data has been obtained from CPC – NWS – NOAA available here There have been three Super Strong El Nino events from 1950 onwards till date. The first such event was 1982-83 Super Strong El Nino with 4 consecutive ONI +2.0°C or above with highest ONI of +2.2°C twice. The second Super Strong El Nino event was 1997-98 with five consecutive ONI +2.0°C or above with highest ONI of +2.4°C twice. The third Super Strong El Nino event was 2015-16 with six consecutive ONI +2.0°C or above with highest ONI of +2.6°C twice. The current forecast and analysis does not support the 2023-24 El Nino to become a Super Strong El Nino.
Indian Monsoon & Enso relationship for India:
Based on earlier more than 100 years weather Data for Indian Summer Monsoon, The Average Rainfall in an El Nino years is 94% of LPA while in La Nina Years it has been 106 % of LPA for the whole country. Monsoon Rainfall over India had been +94.4% of LPA at the end of 30th September 2023. El Nino or La Nina may affect the Monsoon differently for different Regions of India and warrants research for concrete co-relations for each region of India if any. Performance of Southwest Monsoon 2023 over the entire Country was much better than expected.
The Above shows the different "Views " of several agencies...The Actual differs...
Now the Question..
Does Extreme Cold Weather Signal A Warming Earth?
On the heels of NOAA’s National Centers for Environmental Information (NCEI) announcement that 2023 was the warmest year on record, most of the U.S. experienced a blast of extremely cold air, much of it record-setting. These frigid temperatures may seem like the antithesis of global warming but they are also a result of a hotter planet.
It’s estimated that 70 percent of the U.S. population experienced this recent frigid weather in cities across the country. Last week’s temperatures most impacted the central plains; for example, Monticello, Kentucky, saw a low of minus 22 degrees Fahrenheit and minus 18 degrees in Kremmling, Colorado. The cold impacted locations as far south as Alabama, where some locations saw overnight low temperatures near zero, breaking nearly 50-year-old records.
The extreme cold made a significant impact on people, and in addition to frozen pipes and black ice on the highways, the cold made itself known in some unusual ways. In Kansas City, quarterback Patrick Mahomes’ helmet cracked in sub-zero temperatures during a recent playoff game and Tesla car owners struggled to get the lithium batteries to charge in the extreme cold in places like Chicago. More seriously, 72 deaths have been reported in the past week, both as a result of the extreme cold and other winter weather across the nation.
So why have we experienced extremely cold temperatures when the Earth is about two degrees Fahrenheit warmer than it was a century ago? Recent research has confirmed a connection between the warming Arctic waters and cold spells happening deep into the United States. The rapidly warming Arctic weakens the jet stream, allowing the frigid polar air to travel farther south. In the case of this most recent cold spell, the high snowfall near Siberia helped set up a thermal contrast, driving the polar jet stream even further south.
This month’s polar vortex event is very similar to the 2021 event that created chaos in Texas with its unprecedented temperatures. Research supports the fact that climate change has increased the likelihood of polar vortex events like these. The rapid warming in the Arctic fuels the weather patterns that result in these polar vortex events that push south. While the frequency of extreme cold events may be less, the intensity of these events is not decreasing at the same rate.
Coupled with the impact of this year’s El Niño, many regions of the country are seeing active winter weather with frigid temperatures coupled with major snowstorms, creating more challenges for major sporting events, supply chains, and road crews. In particular, the eastern seaboard may continue to see above-average snowfall as the weakening El Niño brings more precipitation to the East Coast during the late winter.
Contribution by Forbes & Jim Foerster....
Jim Foerster is one of just 239 Certified Consulting Meteorologists (CCM) in the world. CCMs are experts in the application of weather information to a host of practical challenges. He serves as Chief Meteorologist for DTN, the largest business-to-business weather organization in the world where he and his team provide actionable weather forecasts and consulting services in the Aviation, Transportation, Marine, Energy, Agriculture and Safety markets.
In the northern Swedish village of Kvikkjokk, air temperatures plummeted to -43.6 degrees Celsius (-46.5 degrees Fahrenheit) on January 3, 2024. It marked the coldest January temperature recorded in Sweden in 25 years, according to news reports.
The extreme temperature comes amid a deep freeze that gripped Scandinavian countries in early January 2024. The extent and intensity of the cold snap is displayed in this map of modeled land surface temperatures—a reflection of how hot or cold a surface would feel to the touch—from 4 a.m. local time in Sweden (03:00 Universal Time) on January 3.
NASA Earth Observatory.
5th December 2023
A Dusting of Snow on Hawaii’s Tallest Peaks
Traces of snow clung to Hawaii’s tallest peaks after a winter storm brought over a foot of precipitation to the chain of islands in late November 2023.
.Hawaiian Islands is often associated with a Kona low, which occurs when winds that typically blow out of the northeast shift and begin to blow from the southwest, over the leeward or “Kona” side of the islands. As the air, laden with moisture from the tropical Pacific, is forced up by the mountainous topography, the moisture precipitates as heavy rain and snow. Kona storms are common between October and April
Antarctica witnessed world’s most intense heatwave in 2022after temperatures soared 39C above normal
In March 2022, temperatures in Eastern Antarctica spiked about 39 degrees Celsius (102.2 degrees Fahrenheit) above the monthly average, said the study “The Largest Ever Recorded Heatwave – Characteristics and Attribution of the Antarctic Heatwave of March 2022”.
Temperatures in an area of east Antarctica - known as "Dome C" - soared to 39C above normal, reaching -10C, on 18 March last year.
The authors say a "highly unusual" weather pattern triggered strong winds from the north, bringing warm and moist air from Australia, and it was made 2C worse by climate change.
The findings add to concerns that climate change is finally catching up with Antarctica, which once seemed relatively shielded.
"There's a real danger, I think, in the years coming ahead that Antarctica starts to behave in a way that looks a lot more like the Arctic... that it stops acting as a refrigerant for the planet, and it starts acting as a radiator."
22nd August 2023
Death Valley received all time record single day rainfall, 55 mm, causing roads to crack and fissures to open.
The caused a flash flood. "Park ranger Abby Wines describes flash floods this way: “Picture the mountains in Death Valley as being a steep building roof. Just like a roof, the rocky slopes don’t absorb much water. The canyons function like a rain spout, channeling that runoff. However, in Death Valley that runoff is a fast-moving muddy soup carrying rocks.”
--------------------------
27th March 2023
A Heat Wave at -37˚C? That’s Bad News at the South Pole
9th March...2023
White Holi for UK 🇬🇧
February 24th ..2023
After traveling for 15 days across the Indian Ocean, Tropical Cyclone Freddy made landfall on the east coast of Madagascar on the evening of February 21, 2023.
Since forming near Indonesia on February 6, Freddy has traveled about 7,200 kilometers across the Indian Ocean, according to the UK Met Office. The 15-day lifespan of the cyclone is unusual; few cyclones travel so far and are sustained for so long. The longest-lived tropical cyclone in the southern hemisphere was Leon-Eline in 2000, which was sustained for 18.5 days and traveled a similar path to Freddy.
2nd February 2023
New York City finally sees snow Wednesday, ending 328-day snowless streak
NEW YORK – It took until February, but New York City finally saw its first measurable snow of the season early Wednesday morning, ending a 328-day snowless streak that dated back to March 2022.
Until this winter, New Yorkers never had to wait this long to experience their first measurable snowfall of the season. The 50-year-old record for the latest first snow was initially broken Monday. In the winter of 1972-73, New York didn't get any measurable snow until Jan. 29, when 1.8 inches finally coated the "city that never sleeps" with its first snow.
The record books have now been rewritten, with Feb. 1, 2023, the new benchmark for New York City's latest first snow. Weather observers at Central Park's Belvedere Castle officially measured 0.4 inches of snowfall as of 6 a.m. EST Wednesday morning.
New York City recorded 0.4 inches of snow early Wednesday morning, Feb. 1, 2023, ending a 328-day snowless streak in the city.
(FOX Weather)
While there had already been a few occasional sightings of snowflakes in Manhattan this winter, the official measuring station in Central Park hadn't observed at least 0.1 inches of snow until Wednesday, which is needed to be considered "measurable" snow and counted as a snowy day in the record books.
18th January 2023..
Al Jazeera.
Dozens of people killed as cold wave sweeps Afghanistan
At least 70 people and 70,000 cattle have died within a week as many provinces witness a cold wave, with temperatures dipping to as low as -33C (-27F).
Children carry containers to fetch drinking water along a road during a cold winter day in the Yaftali Sufla district of Badakhshan province in Afghanistan on January 18, 2023 [Omer Abrar/AFP]----------------------------------------------------------------------------------------------------------------------------------------------------------------------------------------------------------------------------____--------
Impacts of Europe’s extreme winter heat wave visible from space
4th January 2023
A brief note on California Weather and the concept of "Atmospheric River" and "Bomb Cyclone"
Strong Westerly Jet stream at 200 mb over the Pacific with no ridge over US west coast is causing back-to-back frontal systems to hit California.
On December 31 2022, San Fransico saw very heavy rains of 125 mm leading to flooding, road closures and hampering normal life. ( Mumbai, a mega city, gets this in 2 hours at times).
Most of the mega cities in the world cannot handle this amount of rain in a span of 24 hours.
Just for comparison: Mumbai sees many such 100 mm+ events during Monsoon, and the normal life across the city/suburbs is not affected much ( sometimes even if it is around 300 mm or more). Shows our infrastucture is more sustainable unlike other developed countires
What is an Atmospheric River? Below definition from NOAA:
Atmospheric rivers are relatively long, narrow regions in the atmosphere – like rivers in the sky – that transport most of the water vapor outside of the tropics. These columns of vapor move with the weather, carrying an amount of water vapor roughly equivalent to the average flow of water at the mouth of the Mississippi River. When the atmospheric rivers make landfall, they often release this water vapor in the form of rain or snow.
What is a Bomb Cyclone?
A bomb cyclone, also known as bombogenesis, is a fast-developing storm that occurs when atmospheric pressure drops at least 24 millibars over a 24-hour period.
More detailed:Bombogenesis, a term used by meteorologists, occurs when a midlatitude (the latitudes between the tropics and polar regions)cyclonerapidly intensifies, or strengthens, over a 24-hour period. This intensification is represented by a drop in millibars, a measurement of pressure used in meteorology. The intensification required to classify as "bombogenesis" varies by latitude. At 60 degrees latitude, it is a drop of at least 24 millibars (24 hectopascals) over 24 hours. At the latitude of New York City, the required pressure drop is about 17.8 millibars (17.8 hectopascals) over 24 hours. (Source: National Ocean Service, NOAA)
2022 Dec..
24th December 2022
75-degree temperature drop from Wednesday’s high to Thursday’s low was the second-largest two-day swing on record in Denver..
Temperatures at Denver International Airport dropped to minus 24 degrees Thursday morning, marking the coldest December day since 1990 and 1 degree away from setting a record low for the month, according to the National Weather Service in Boulder.
The 75-degree temperature drop from Wednesday’s high to Thursday’s low was the second-largest two-day swing on record in Denver, according to the weather service. And it came with about 4 inches of fresh snow.
----------------------
12th December 2022
London Coated In First Snow Of Winter After Cold Snap
By Justine GERARDY
Order Reprints
Print Article
BARRON'S NEWSLETTERS
Barron's Tech
London coated in first snow of winter after cold snap
YOU MAY ALSO LIKE
London coated in first snow of winter after cold snapPlay video: London coated in first snow of winter after cold snap
London coated in first snow of winter after cold snap
Londoners wake up to a white morning in the first winter snowfall of 2022 after a cold snap that saw yellow warnings issued for the capital. Overnight snow has caused major travel disruptions, with flights cancelled and train and road networks experiencing major delays.
First cold air masses are seen in Siberia and Central Asia with the decline of the season.
Rare early cold temperatures and frosts affected parts of Southern Siberia,Mongolia and even Kazakhstan where Leninogorsk (50N,800m asl) today had its earliest since 2011
Credit for information Max Herrera
July 2022...USA Heat Waves
July heat records shattered across the U.S.
24th May ...2022
Spain experiences record-breaking heatwave for May
By Alex Hardie, CNN and Reuters
(CNN)Parts of Spain have experienced a record heatwave for the month of May as temperatures reached 40.3 degrees Celsius (104.5 degrees Fahrenheit) in one city, according to the country's national weather agency AEMET.
On Sunday afternoon, the weather agency had warnings of high temperatures in place across 17 Spanish regions.
According to Reuters, people in the south of the country "waved fans, glugged water and splashed themselves at fountains" on Saturday as the heatwave descended on the region.
On Friday, the city of Jaén in Andalucía, southern Spain, recorded a temperature of 40.3 degrees Celsius.
In a tweet, the Spanish weather agency said that, in the case of Jaén, temperatures were up to 16 degrees Celsius (28.8 degrees Fahrenheit) higher than the average for the time of year.
3rd April ...2022
Heat Wave in Indian Sub Continent.....and in Europe.... Snow !
European Cities Blanketed In Snowfall
click on Picture for enlarged view
Cities across France, Germany, Poland, and Spain have been blanketed with snow as they welcome the new month of April with a cold wave. The power grid operator in France requested French companies and local authorities to reduce their energy consumption because of increased demand because of cold.
Vineyards in France
Green Trees in Frankfurt
Paris stunned by snowfall in April, a week after temperatures hit highs of 20°C
The unexpected cold snap is due to an Arctic air mass over Western Europe.
People in Paris were shocked to wake up to heavy snowfall and a blanket of white outdoors on the first day of April.
29th March...2022
What causes the temperature to rise?
The impact of trapped air is heatwaves. Air usually circulates around the world in vast prevailing winds, but when it is stuck over one place, it is able to warm to unusual levels due to sunlight. Owing to high pressure systems, air is frequently caught. The air is forced downward by these systems, which operate as a big cap. Because the air is confined, it is unable to rise into the colder upper atmosphere and precipitation is prevented.
As the sun moves north, the month of March is when the area ranging from Maharashtra to Odisha becomes a heat region, according to climatology. The warmer temperatures, according to reports, are due to the wind flow pattern in these places. Lower-level winds blow from the south to the north in these places, bringing hotter air from the land. The rising temperature is also aided by scorching breezes from India's desert region.
Bizarre heat waves strike Arctic and Antarctic poles, raising them 50 and 70 degrees Fahrenheit above normal
The situation on Earth's poles is no different, with the climate catastrophe spreading and its impacts being felt not just in India but around the world. As the earth heats, both the Arctic and the Antarctic are feeling the heat. Scientists have warned that the already deteriorating climatic situation on the planet will deteriorate even faster and more abruptly.
MORGAN MCFALL-JOHNSEN
MAR 23, 2022, 23:15 IST
Antarctica and the Arctic suffered heat waves in the past week, reaching 70 and 50 degrees Fahrenheit above normal.
The poles are in opposite seasons, but atmospheric rivers carried moisture and warm air to them.
Heat waves blanketed the planet's poles in unseasonably warm temperatures over the past week.
In parts of the Arctic, temperatures soared to about 50 degrees Fahrenheit (30 degrees Celsius) above average on Friday, according to The Associated Press. The same day, on the other end of the planet, Antarctica's Dome C research station registered a record temperature of 13.8 degrees, about 70 degrees above average. Vostok station, sitting 2 miles high on the Antarctic plateau, registered a similarly extreme temperature of 0.1 degrees.
As of Tuesday, the Antarctic heat wave was subsiding, but temperatures remained about 50 degrees above normal, according to Robert Rodhe, lead scientist at the environmental data nonprofit Berkeley Earth.
"This event is rewriting record books and our expectations about what is possible in Antarctica," Rodhe said on Twitter. "Is this simply a freakishly improbable event, or is it a sign of more to come? Right now, no one knows."
Two Adelie penguins stand atop a block of melting ice on a rocky shoreline at Cape Denison, Commonwealth Bay, in East Antarctica, on January 1, 2010.Pauline Askin/Reuters
The poles are in opposite seasons — it's fall in Antarctica, just starting to chill, while the Arctic is emerging from the dark depths of winter. But the mechanisms driving their respective heat records are the same. Atmospheric rivers — long, flowing columns of water vapor, like rivers in the sky — carried large amounts of moisture and warm air to both poles, causing the double-whammy polar heat w
In Antarctica, a high-pressure system called a "heat dome" also moved in and sat over the eastern side of the continent, trapping heat and moisture there, according toThe Washington Post.
"Are these two heat waves linked? We don't know yet, and it's most likely a coincidence," Antarctica researchers Dana Bergstrom, Sharon Robinson, and Simon Alexander wrote in The Conversation on Tuesday.
Still, they added: "Modeling suggests large-scale climate patterns are [becoming] more variable. This means this seemingly one-off heat wave may be a harbinger for the future under climate change."
The poles are warming faster than the rest of the planet
A penguin stands on an iceberg in Yankee Harbour, Antarctica, on February 18, 2018.Alexandre Meneghini/Reuters
While scientists can't directly attribute these warming events to climate change, it's possible that later studies will allow them to do so. Just a week after a record heat wave killed hundreds of people across the Pacific Northwest last June, World Weather Attribution published a study that concluded the event would have been "virtually impossible" without human-caused climate change.
Global temperatures are rising as humans add more heat-trapping gases like carbon dioxide to the atmosphere, and the poles are warming faster than the rest of the
Periods of warmth during the winter are a natural part of the Arctic climate, butresearchshows they're happening more frequently and lasting longer as the planet warms. In Antarctica, a lack of historical records makes it difficult to contextualize this weather.
A drop of water falls off an iceberg melting in the Nuup Kangerlua Fjord in southwestern Greenland, on August 1, 2017.David Goldman/AP Photo
"The first of the precise temperature records start in the late 1950s, so it's really hard to work out what's remarkable and what's not," Matt King, director of the Australian Centre for Excellence in Antarctic Science, told The Guardian. "Sometime down the track, depending on what we do with our carbon emissions, we might see these types of temperatures much more regularly."
Alongside the heat wave, and possibly because of it, Arctic sea ice coverage dropped suddenly this month, according to data from the Norwegian Meteorological Institute.
At the other pole, even before the heat wave, Antarctica was at its lowest sea ice coverage since records began, The Guardian reported in February.
What happened in Antarctica?
A stagnant, extremely intense pressure system stationed southeast of Australia caused the heatwave in Antarctica, transporting massive amounts of warm air and moisture down into the continent's interior. It was accompanied by a severe low pressure storm over the interior of East Antarctica.
To make matters worse, cloud cover engulfed the Antarctic ice plateau, trapping heat from the surface. Because it's fall in Antarctica, the continent's core temperatures aren't warm enough to melt glaciers and the ice cover.
However, the situation is said to be completely different on the coast, where rain has fallen, which is unusual for the continent. An atmospheric river - a narrow band of moisture accumulated from warm oceans – was chiefly responsible for the rain. Atmospheric rivers are found on the outskirts of low-pressure systems and have the ability to transport massive amounts of water over vast distances on scales larger than continents.
Despite their uncommon, atmospheric rivers contribute significantly to the continent's ice sheets by dumping significant volumes of snow. Rain, rather than snow, occurs over Antarctica as surface temperatures reach above freezing.
Temperatures in the region normally sit around -51 degrees Celsius at this time of year, but they were around -12 Celsius earlier this month. They have now gone back to normal, Neff said.
Surrounded by vast oceans and buffered by winds that tend to protect it from large warm-air intrusions, the frozen continent is responding more slowly to climate change than the Arctic, which is warming at three times the rate of the rest of the world.
In the last century, East Antarctica barely warmed at all, but some regions have been affected and the continent lost an average of 149 billion tonnes of ice per year from 2002 to 2020, according to NASA. The loss of the Conger Ice Shelf is the latest example of changes afoot.
Sensational News from The South Pole Record broken by 15°c !! Above normal by 40°c !!
Ĥ
3rd February 2022
After being soaked in mid-January 2022 by persistent, flooding rainstorms and Tropical Storm Ana, citizens of Madagascar are bracing for the arrival of another potent cyclone. Forecasters from the U.S. Joint Typhoon Warning Center suggest Cyclone Batsirai is likely to make landfall on February 5 in central Madagascar between Mahanoro and Mananjary as a category 2 storm.
excellent Images for Academic Interest ⬇⬆
29th January 2022
After several mostly uneventful months of winter, the densely populated northeastern United States was buried in mounds of snow and blasted by gale-force winds on January 28-29, 2022. Twelve states from North Carolina to Maine received measurable snowfall from the nor’easter; eight of them had towns report more than a foot (30 centimeters) of snow.
27TH January 2022
Cold wave in Israel: Jerusalem wakes up under a blanket of snow
8th December 2021
Climate and things don't change!mber 2021
12th September 2021
Unusual Snowfall in Greenland
The remnants of Hurricane Larry dropped abundant snowfall on Greenland just as the summer melt season was coming to an end.
Hurricanes are known for their destructive wind, rain, and storm surge. Hurricane Larry delivered more than that. On September 12, 2021, the storm’s remnants dropped abundant snowfall on Greenland just as the summer melt season was coming to an end.
Snowfall amounts on that day are visible in the map above, as represented by the Goddard Earth Observing System (GEOS) model. Snowfall amounts are shown as millimeters of water, as opposed to snow depth, for the 24-hour period. Fifty millimeters of water is equivalent to about 250 millimeters (10 inches) of snow, assuming the snow has a density of 250 kilograms per cubic meter.
Through early September, Hurricane Larry traveled northwest across the Atlantic Ocean reaching a peak strength of category 3 on the Saffir-Simpson wind scale. It weakened as it turned north, staying well offshore of the U.S. East Coast, and then made landfall as a category 1 storm over Newfoundland in eastern Canada on September 11.
Next, Larry reached Greenland on September 12 as a post-tropical storm, delivering high winds and copious snowfall to the island’s southeast and interior. Kulusuk and Tasiilaq saw winds gusts topping 90 miles (145 kilometers) per hour and blizzard conditions were reported at Summit Station.
“Such storms are quite rare,” said Lauren Andrews, a glaciologist with NASA’s Global Modeling and Assimilation Office. “They generally dissipate well before reaching as far north as Greenland. Though there have been similar storms, including Noel in 2007 and Igor in 2010.”
Andrews also noted that it is unusual to see such a high rate of snowfall so soon after the end of the summer melt season, which occurs each year from around May to early September. In fact, the recent snowfall from ex-hurricane Larry could potentially balance out losses from melting during the summer, which included three notable melting events—two in July and one in August.
“It is a dramatic end to a season of extreme events across the Greenland ice sheet,” Andrews said.
Once the satellite data are fully processed, scientists will be able to gauge the state of Greenland’s mass balance. A positive mass balance means that more snow was gained than was lost through processes such as melting and runoff. So far, Andrews said, “It looks like 2021 will end up having an above average surface mass balance.”
NASA Earth Observatory image by Joshua Stevens, using GEOS-5 data from the Global Modeling and Assimilation Office at NASA GSFC. Story by Kathryn Hansen.
30th July 2021
Snowfall Happens In 13 Cities Of Cold snap-Hit Brazil - Report
A fierce cold snap led to snowfall in Brazil in an unusual wintry phenomenon. The last time a blizzard hit Brazil was in 1957, according to USA today.
Children took to the streets to build up snowmen for the first and probably the last time of their lives
At least 13 cities in the Brazilian State of Río Grande do Sul Wednesday recorded snowfalls, a rare event for the region, but one that has come to be due to this year's harsh winter temperatures.
Snow was recorded in cities such as Pelotas, São Francisco de Paula, Gramado, Carlos Barbosa, Bagé, Herval, Piratini, Caxias do Sul, Marau and Farroupilha, it was reported.
The wave of cold air that passes through southern Brazil brought snow to at least 13 cities in Rio Grande do Sul, in addition to frozen rain.
According to Somar Meteorologia, there was snowfall in Pelotas, São Francisco de Paula, Gramado, Carlos Barbosa, Bagé, Herval, Piratini, Caxias do Sul, Marau and Farroupilha, where children took to the streets to celebrate and build up snowmen, which are very foreign to the area.
Other parts of Rio Grande do Sul were less blessed by nature and instead of snowfalls they recorded hail-like phenomena, such as “frozen rain” (when water droplets freeze when fallinf off the cloud, but melt when they touch the ground).
Snowflakes descend from clouds in a region that is quite cold and fall in a region of the atmosphere that is warm. The phenomenon was registered at least in Júlio de Castilhos, Nova Petrópolis, Itaara, Tupanciretã, Canguçu and Lavras do Sul.
In addition, according to Somar Meteorologia, there was graupel, which is a small granule of ice created when drops of super-cooled water cover a snowflake. graupel is white, opaque, soft and can easily fall apart in your hand, and it is also generally smaller than hail, with a diameter of about 0.2cm to 0.5cm.
A historic wave of cold is passing through Brazil, bringing snowfall to the southernmost state of Rio Grande do Sul, the G1 news portal said.
On Wednesday it snowed in at least 13 cities, including Pelotas, Sao Francisco de Paula, Carlos Barbosa, with hail registered in some cities, according to the Brazilian news outlet. People took to the streets to have snowball fights and make snowmen.
Meteorologists forecast temperatures down to -10�C (14�F), with record low temperatures likely to be registered in southeastern cities this Friday and Saturday.
In the southern state of Santa Catarina, thirty districts registered temperatures lower than -7�C (19.4�F). Rio de Janeiro reported 4-meter (13-foot) waves.
The cold is expected to affect next year's coffee crop heavily, since the low temperatures have hit Brazil in the heart of its coffee belt. Cooxupe, the largest private coffee cooperative around the globe, sent technical specialists to assess the possible damages to coffee plantations.
Day after day of 90-plus-degree heat and high humidity has forced organizers to reschedule rugby matches and mountain biking competitions and move some track and field events to early morning hours or dusk to avoid the roasting afternoon sun.
Other events, like the marathon and race walking, have been moved completely out of Tokyo to the cooler city of Sapporo, capital of the mountainous northern Japanese island of Hokkaido and the site of the 1972 Winter Olympics.
For the athletes competing in Tokyo, the organizers have erected cooling tents, hauled in water-mist fans and started providing ice cream to the army of volunteers helping run the Games.
Compared to 1964, which was the last time Japan hosted the Summer Olympics, the July and August temperatures in Tokyo are 2.7 degrees warmer, and there are now, on average, eight more days of 95-plus-degree weather than there were 57 years ago, Prociv said.
“If you start to feel lightheaded, nauseated or confused, stop and seek medical care,” he added. “Heatstroke can often go unnoticed until an athlete is in the danger zone, and that can be life-threatening.”
Article by Corky Siemaszko, NBC
wave Corky S is a senior writer for NB Olympic organizers battle to 1ST JULY
Posted 1 st July 2021:
Death Valley Hits 130 Degrees as Heat Wave Sweeps the West 54.4c...Not yet Highest !!
8th July
Visitors took photos on Saturday with a temperature display at the visitors center in Furnace Creek at Death Valley National Park.Credit...Roger Kisby for The New York Time
Western Canada burns and deaths mount after world’s most extreme heat wave in modern history
It's not hype or exaggeration to call the past week's heat wave the most extreme in world weather records.
byBOB HENSON and JEFF MASTERS The poster community of this horrific episode has to be Lytton, British Columbia. The town broke Canada’s longstanding all-time national high temperature of 45 degrees Celsius (113 degrees Fahrenheit) with a high of 46.6°C (116°F) on Sunday, June 27. The next day brought 47.9°C (118.2°F), and Tuesday a stunning 49.6°C (121°F). The lighting from the dry thunderstorms (pyrocumulonimbus) that developed was so intense that over 700,000 intracloud and cloud-to-ground lightning flashes were recorded in 15 hours, including more than 100,000 cloud-to-ground strikes. That’s about 5% of the total number of lightning flashes Canada typically sees in an entire year https://twitter.com/i/status/1410436497329721348...Chck the pyro cumulonimbus developing and the lightning within ! Extraordinary ! The World's Highest on 2nd July !
Maximum Temperature Last 24h - 07/03/2021 at 06:00 UTC
Coldest inhabited place on Earth is baking in record heat
ByZachary Rosenthal, AccuWeather staff writer
Oymyakon, Russia, which is widely considered the coldest inhabited place on Earth, is not living up to its reputation.
The town hit a maximum recorded temperature of 88.8 degrees Fahrenheit (31.6 degrees Celsius) on Tuesday, the hottest it has ever been in June. The last three days in Oymyakon have been similarly hot, with temperatures reaching 86 F.
AccuWeather Senior Meteorologist Jason Nicholls says that the weather will continue to cool off a bit, with observed high temperatures in the upper 70s on Thursday and then forecast in the upper 70s again on Friday, but that the heat will return over the weekend.
"It looks to turn warmer again on Saturday with highs around 30 C (86F). Not quite as warm Sunday but still warm by Oymyakon standards, getting up to 82 F (28 C)," Nicholls said.
Located in the Sakha Republic of Russia, the town of about 500 residents typically endures frigid temperatures. According to The Siberian Times, the lowest officially recorded temperature in Oymyakon was -67.7 below zero C in 1933.
This past January, temperatures in Oymyakon plummeted to an extremely frigid -73 F, meaning temperatures in the city have varied by a whopping 161 degrees Fahrenheit this year.
Oymyakon is in a permafrost region, meaning that there is ground which continuously remains below 32 F (0 C).
Oymyakon is about 200 miles south of the Arctic Circle, a region many people assume is cold year-round, but the air there can get warm as recent thermometer readings demonstrate.
On June 24, in Inuvik, Northwest Territories, Canada, which is 100 miles north of the Arctic Circle, the temperature hit 86 F. In Little Chicago, Northwest Territory, Canada, the temperature reached 91 F.
This past week, the Pacific Northwest also experienced all-time record heat. Portland shattered its daily high-temperature record three days in a row; the record currently stands at 116 F. In Canada, a new all-time high temperature was set in Lytton, British Columbia, where the mercury shot up to 121.1 F (49.5 C) on Tuesday, according to the BBC.
Heat wave leaves Moscow sweltering under temps not reached since 1901
ByMaura Kelly, AccuWeather meteorologist
A blistering heat wave that has been enveloping eastern Europe nudged its way into western Russia this past week, challenging Moscow records that have stood for more than a century and forcing the city to face heat rarely felt in this region of the world.
On Tuesday, parts of Moscow reached 94.5 degrees F (34.7 degrees C), according to an official reading by the Russian weather service Roshydromet, which ties the all-time June record set in 1901.
Preliminary temperature reports show the Russian capital reached 95 F (35 C) on Wednesday, which may break the record high temperature for June. Then, the high reached 93 F (34 C) on Thursday.
This highest temperature ever recorded in Moscow, 100.4 F (38 C), was recorded in July 2010 when a heat wave engulfed western Russia and wildfires were common across the region, AFP reported.
St. Petersburg, located about 370 miles (600 km) to the northwest of Moscow, also hit 94 F (34 C), 92 F (33 C) and 97 F (36 C) on Monday, Tuesday and Wednesday, respectively. These are some of the highest temperatures for the city since 1998, according to AFP.
Heatwave Scorches the Middle East
June 6, 2021
The map above shows air temperatures in the region on June 6, 2021. The map was derived from the Goddard Earth Observing System (GEOS) model and depicts air temperatures at 2 meters (about 6.5 feet) above the ground. The darkest red areas are where the model shows temperatures around 50°C (122°F).
The GEOS model, like all weather and climate models, uses mathematical equations that represent physical processes (such as precipitation and cloud processes) to calculate what the atmosphere will do. Actual measurements of physical properties, like temperature, moisture, and winds, are routinely folded into the model to keep the simulation as close to observed reality as possible.
Indeed, local ground stations recorded temperatures that climbed above the 50°C mark in at least four Middle Eastern countries, including Iran, Kuwait, Oman, and the United Arab Emirates (UAE). According to news reports, Sweihan in the UAE hit 51.8°C (125.2°F) on June 6, 2021, which was the country’s highest temperature on record for the month of June. Countries in Central and South Asia were also reported to have seen extraordinarily high temperatures for the time of year.
Meteorologists at The Washington Post reported that the heatwave is the result of a “heat dome.” The phenomenon occurs when high pressure in the mid- to upper-atmosphere acts as a cap, trapping warm air as it rises and pushing it back toward the surface to warm even more. A notable occurrence of the phenomenon caused temperatures to soar across the Middle East in July and August 2015. The heatwave this year comes about a month before the hottest temperatures of the season typically arrive.
Troliest named tropical storm in a calendar year in the Eastern Pacific on record.
---------------------Breaking the record of 2017 Storm #Andres is the earliest named tropical storm in a calendar year in the Eastern Pacific on record.
Breaking the record of 2017Tropical Storm #Andres is the earliest named tropical storm in a calendar year in the Eastern Pacific on record.
Breaking the record of 2017 named tropical storm in a calendar yeFebruary 25, 2021
The Extreme Temperature Changes of Texas
Few places in the world experience more rapid and extreme temperature changes than Texas.
A place whether the temperature can be 80F at noon and 15F by midnight.
A state where a phenomenon called the Blue Norther can produce extreme winds with rapid temperature declines.
Consider the case Austin, Texas, a city that not a few Northwesteners are thinking of moving to. Below is a figure that shows the observed highs and lows (black bars), as well as the normal temperature range (green band) and the record highs and lows for February.
In the beginning of the month, temperatures were above normal, with some days offering highs around 80F. But then around Feb. 10th, the bottom dropped out, with lows getting to 6F on Feb. 16tth. And later in the month, they were above normal again. Texans have to be a tough breed to deal with these changes!
Look closely at the record highs and lows. Record highs are in the 80s in the early part of the month and around 100F by the 21st, while record lows are in the single digits to the teens. And it is not unusual to gyrate between the two quickly.
The rapid transition from summer warmth to Arctic cold is not usual in Texas--so frequent that they have a name for it, the Blue Norther. Sometimes called the Texas Norther.
Moderate blue northers (temperature declines of 10-20F), typically occur several times per year, and the mega-events, like this month (with temperature declines of 30-60F), happen every decade or so.
Such very large temperature declines have been noted as long as Texas has been occupied and is certainly not a new phenomenon. Texas cold waves are not the result of the "global weirding" that is so popular in the press but a natural part of Texas weather.
From Cliff Mass Weather Blog
22nd February 2021
Fact check: It is snowing in Saudi Arabia…and it is not rare
By Satya Priya BNPublished on 22 Feb 2021 1:40 PM
18th February 2021
From Paris to Athens, from Hawaii to Texas, Heavy Snow Blankets the Globe
Old Man Winter is living up to his reputation this month across the Northern Hemisphere, with heavy snow reported in places that don’t see snow too often. Two weeks ago, 1 to 2 feet of snow fell on the Big Island of Hawaii; since then, additional snow has fallen across the higher elevations of both Hawaii and Maui islands. Just last week, Paris was hit by a severe winter storm, encasing famed attractions like the Eiffel Tower in snow and ice. Greece turned into a winter wonderland yesterday, with Athens seeing its biggest snowfall since 1987. And now the United States is dealing with what seems like an endless parade of winter storms, including one which brought snow and freezing temperatures to the Texas Gulf Coast. Yesterday, snow blanketed 73% of the continental United States, which is the greatest greatest extent of snow cover on record in the database, which dates back to 2003.
A new record was set yesterday (based on data back to 2003) of the most snow cover across the continental U.S. Image: NWS
17th February
The recent snow has also been joined by cold blasts. The United Kingdom, along with large parts of northern Europe, is starting to that-out from unusually cold period of weather. Just days ago, on February 11, the Scottish Highlands village of Braemar -23.0°C (-9.4°F), the United Kingdom’s coldest temperature since 1995 and the coldest February temperature since the 1950s. Asia has been cold too. Earlier this month, authorities were fearing blackouts would roll through Japan due to a shortage of powerplant capacity in cold weather conditions and a shortage of fuel needed for those electrical generating stations.
Cold and snow is even popping-up in the southern Hemisphere. Just weeks ago, cold and snow arrived in southern New Zealand. While it’s the middle of summer in the Southern Hemisphere, more than 3″ of snow fell at the Cardrona Alpine Resort on the country’s south island, south and west of Christchurch....Weatherboy
7th February 2021
Snowstorm pounds parts of Europe; Germany, Britain, Lithuania and Netherlands turn winter landscapes
Snowstorm and strong winds pounded parts of Europe on February 7, turning the Netherlands, England, Germany and Lithuania into winter landscapes. The unusual weather and temperature divide was caused by a polar vortex pushing icy air from the Arctic toward northern and western regions of the continent.
7th February 2021
U.S. and North America;
DANGEROUS COLD: Early this morning we were on the southern edge of a large Arctic air mass. It was -47° at Yellowknife in the Northwest Territories of Canada, while it was 61° in Dallas, TX. The pattern is set up so that we will be a part of this expansive Arctic air for 7-10 days. The temperature contrast is also responsible for our snow chances. More on the snow below.
January 11th 2012
Between January 7–9, 2021, a moist, low-pressure weather system over the ocean collided with a cold air mass sitting over western Europe. The result was the heaviest snowfall over Spain in fifty years.
After barely seeing significant snowfall for a decade, the capital city of Madrid was blanketed with widespread accumulations of 20 to 30 centimeters (8 to 12 inches). Some suburban and rural areas in central, northern, and eastern Spain were coated with up to 50 centimeters (20 inches) of snow.
January 5th 2021
AUSTRALIA: THE WARMEST DAY IN HISTORY – THE HEAT WAVE CONTINUES
In Australia, it is warmer than at any time since weather records began in 1910. According to an analysis by the Australian Weather Service, the average high temperature on Tuesday was 40.9 degrees. The previous record was 40.3 degrees and it was measured in January 2013. The average temperature extremes across the country are the most accurate measurement of a heat wave.
Current temperatures reach 16 degrees above the long-term average.
January 8th 2021
The nights have been very cold in the Iberian Peninsula, but Spain wins the record-low-temperature prize
Several stations, some run by meteorological aficionados but who record values in real time, believe that the temperature of -34.1ºC (-29.4ºF)has been reached in Clot del Tuc de la Llança, in the Pyrenees, in the province of Lérida.
The negative temperature of -34.1ºC was first recorded by ” Projecte 4 Estacions “. Two unofficial meteorological organizations, the website “Meteo Valls d’Àneu” and “MeteoPirineu.com” say the cold record was set at 4.19 pm this Wednesday in Spain . Both sites receive data from a weather station installed at a ski resort, according to the newspaper “La Vanguardia”.
The Aragon delegation from the State Meteorological Agency and Noromet and the Meteorological Association of the Northwest Peninsular, have both officially recognized the figures. However, the record has not yet been validated by the Meteorological Service of Catalonia , where Clot del Tuc de la Llança is located .
The Spanish press says the number of -34.1ºC is considered very likely. “La Vanguardia” says this beats the record set in 1956 of -32ºC in Estany Gento (a lake of glacier origin), in Vall Fosca , in the Spanish municipality of Torre Cabdella .
In the last few days, negative temperatures have been constant in Spain , especially in mountainous regions. In the Navarra region, for example, on Tuesday night some areas of the Pyrenees and the Urbasa mountain range registered values below -10ºC.
By Robert
December 28th 2020
Britain will be buried in up to SIX INCHES of snow before New Year's Day: Met Office issues four-day warning for large swathes of the country - including London
13:00 GMT Jersey Airport 10:00 GMT Scilly, Saint MaryS 12:00 GMT Jersey 12:00 GMT Valentia Observatory 11:00 GMT Scilly St Marys 12:00 GMT 12:00 GMT Isle Of Man 08:00 GMT Guernsey Airport 09:00 GMT Alderney / Channel Island 05:00 GMT Chivenor 13:00 GMT Belmullet 12:00 GMT Bridlington Mrsc 04:00 GMT Camborne 13:00 GMT Ronaldsway 08:00 GMT Isle Of Portland 00:00 GMT Malin Head 13:00 GMT Valley 10:00 GMT Culdrose
Europe freezes
December 29th 2020
It’s time to look at sea ice habitat at 15 December (Julian Day 350), now that virtually all bears except pregnant females throughout the Arctic are either out on the sea ice attempting to hunt for seals or hunkered down against the darkness.
As is usual at this time of year, the Canadian Archipelago, the Beaufort, East Siberian and Laptev Seas are well covered in ice (see regions on map below). As for the rest, despite what one polar bear specialist has implied there is no evidence that a slower-than-usual fall freeze-up in the other peripheral seas of the Arctic negatively affects polar bear health or survival.
November 30th 2020
NSW heading for severe Heat wave this week:
Record Heatwave in Sydney Australia:
Sydney recorded its hottest November night as Australia's largest city suffered through a weekend heat wave that saw daytime temperatures peak above 40 degrees Celsius.
The temperature reached above 40 degrees for the second consecutive day yesterday.
The overnight temperature did not drop below 25.3 degrees, making it the hottest November night on record.
November 22nd 2020
Gati Makes Historic Landfall in Somalia
On November 22, 2020, Cyclone Gati became the strongest storm to hit Somalia since satellite records began five decades ago. Gati made landfall with maximum sustained winds of 170 kilometers (105 miles) per hour, a category 2 storm on the Saffir-Simpson scale. The storm brought more than a year’s worth of rain to the region in two days. Local authorities report at least eight people were killed and thousands have been displaced.
In 12 hours, Gati’s winds intensified from 65 kilometers (40 miles) to 185 kilometers (115 miles) per hour—the largest 12-hour increase for any tropical storm ever recorded in the Indian Ocean. The storm rapidly intensified due to its small size, warm Indian Ocean waters, and low wind shear. Although the storm slightly weakened before landfall, Gati brought exceptional amounts of rain to northern Somalia.
Much of northern Somalia, which typically receives about 10 centimeters (four inches) of rain in an entire year, received at least that much in two days. The city of Bosaso reported 12.8 centimeters (5 inches) in 24 hours.
November 2nd 2020
Nepal recorded its hottest November day ever with 35.5C at Bhairawa, the previous record was 35.2C at Dipayal in 2001.....From Max.
‘The Northern Hemisphere winter of 2020/21 is shaping up to be a doozy,” says reader Martin Siebert.
The latest CFSv2** forecast for region 3.4 of the central equatorial Pacific Ocean reveals that a flip from the recent El Niño setup (warming) to a La Niña one (cooling) has occurred.
CFSV2 FORECASTS LA NIÑA (COOLING) INTO 2021
La Niña’s are usually associated with coolerglobal average temperatures, droughts in the southern U.S., and anomalously wet conditions in Australia.
The latest CFSv2 forecast for region 3.4 of the central equatorial Pacific Ocean reveals that a flip from the recent El Niño setup (warming) to a La Niña one (cooling) has occurred.
The below chart shows Sea Surface Temperatures (SSTs) for region 3.4. of the equatorial Pacific: that black-dash line has dipped deep into La Niña territory, and the model sees this persisting through the remainder of 2020 and into 2021:
October 15th 2020
For Comparison
October 10th 2020:
Louisiana has now had four named storm landfalls in 2020 (Cristobal, Laura, Marco and #Delta). 2020 is now tied with 2002 for the most Louisiana named storm landfalls in a single season on record. In 2002, Bertha, Hanna, Isidore and Lili made landfall in Louisiana.
The most recent October Louisiana #hurricane landfalls by Saffir-Simpson category are: Category 1: Nate (2017) Category 2: Hilda (1964) Category 3: Texas-Louisiana Hurricane (1886) Category 4: Chenier Caminanda (1893) Category 5: None on record
Delta is the 10th named storm to make landfall in the continental US this year - the most in a single Atlantic hurricane season on record. Prior to 2020, the most named storms to make landfall in the continental US was 9 set in 1916
Info by Vagarian Vineet Kumar (IITM )
September 28th 2020:
Coldest Northern Hemisphere temperature, first recorded by UW, officially confirmed
MADISON, Wis. — Nearly 30 years after recording a temperature of minus 93.2 degrees Fahrenheit (minus 69.6 Celsius) in Greenland, the measurement has been verified by the World Meteorological Organization as the coldest recorded temperature in the Northern Hemisphere.
The measurement was first recorded by a University of Wisconsin-Madison Antarctic Meteorological Research Center Automatic Weather Station in December 1991. An AWS is a standalone instrument suite developed by UW-Madison Space Science and Engineering Center and AMRC scientists and engineers to collect numerous environmental parameters such as air temperature, pressure, humidity, wind direction and speed. The information is then relayed via satellite back to SSEC in near real time.
Extreme measurements like that in Greenland undergo a rigorous review process to make sure they are accurate and there is agreement with other meteorological data and weather forecast models. Due to the quality and preservation of the AWS station data provided by the Antarctic Meteorological Research Center, the WMO was able to verify the 1991 temperature and log it as part of the official record.
According to Weidner, this cold temperature was the result of several atmospheric conditions converging in a specific way.
The Klinck field site, where the coldest temperature was measured, is located in the middle of Greenland at an elevation of 10,170 feet (3,100 meters). Extreme cold air temperatures can occur when there is little wind to disturb an area, accompanied by clear skies.
In this case, the elevation and a splitting of the jet stream — which usually flows over the Greenland ice sheet — created a dead zone, allowing the already cold region to continue losing heat from the Earth. Similar conditions occur over Canada and result in the famed (or infamous) “polar vortex,” which produces extreme cold that reaches the U.S.
September 24th 2020
Big Chill...U.K. to be Battered by Torrential Rains and Gales...Temperatures to Plunge...Artic Blast to Hit U.K.
Beta storm made landfall in US, this is the 9th named storm to make landfall in Continental US this season. This equals the record of 1916 of most continental US landfalls
September 17th 2020:
We have talking a lot of the fires in U.S. ...The Fact of Fire History.
Irrefutable NASA data: global fires down by 25 percent
Using satellite technology, NASA determined that between 2003 and 2019, global fires have dropped by roughly 25 percent. This makes the “climate change is worsening wildfires” argument completely moot.
The control of fire is a goal that may well be as old as humanity, but the systematic monitoring of fire on a global scale is a much newer capability.
In the 1910s, the U.S. Forest Service began building fire lookout towers on mountain peaks in order to detect distant fires. A few decades later, fire-spotting airplanes flew onto the scene. Then in the early 1980s, satellites began to map fires over large areas from the vantage point of space.
Over time, researchers have built a rich and textured record of Earth’s fire activity and are now able to analyze decadal trends. “The pace of discovery has increased dramatically during the satellite era,” said James Randerson, a scientist at the University of California, Irvine. “Having high-quality, daily observations of fires available on a global scale has been critical.”
The animation above shows the locations of actively burning fires on a monthly basis for nearly two decades. The maps are based on observations from the Moderate Resolution Imaging Spectroradiometer (MODIS) on NASA’s Terra satellite. The colors are based on a count of the number (not size) of fires observed within a 1,000-square-kilometer area. White pixels show the high end of the count—as many as 30 fires in a 1,000-square-kilometer area per day. Orange pixels show as many as 10 fires, while red areas show as few as 1 fire per day.
December 1, 2014 – August 31, 2015
The sequence highlights the rhythms—both natural and human-caused—in global fire activity. Bands of fire sweep across Eurasia, North America, and Southeast Asia as farmers clear and maintain fields in April and May. Summer brings new activity in boreal and temperate forests in North America and Eurasia due to lighting-triggered fires burning in remote areas. In the tropical forests of South America and equatorial Asia, fires flare up in August, September, and October as people make use of the dry season to clear rainforest and savanna, as well as stop trees and shrubs from encroaching on already cleared land. Few months pass in Australia without large numbers of fires burning somewhere on the continent’s vast grasslands, savannas, and tropical forests.
But it is Africa that is truly the fire continent. On an average day in August, the Moderate Resolution Imaging Spectroradiometers (MODIS) on NASA’s Aqua and Terra satellites detect 10,000 actively burning fires around the world—and 70 percent them happen in Africa. Huge numbers of blazes spring up in the northern part of continent in December and January. A half year later, the burning has shifted south. Indeed, global fire emissions typically peak in August and September, coinciding with the main fire seasons of the Southern Hemisphere, particularly Africa. (High activity in temperate and boreal forests in the Northern Hemisphere in the summer also contribute.)
August 29, 2018
The second animation underscores how much fire activity shifts seasonally by highlighting burning activity during December 2014, April 2015, and August 2015. The satellite image above shows smoke rising from the savanna of northern Zambia on August 29, 2018, around the time global emissions reach their maximum.
Though Africa dominates in the sheer number of fires, fires seasons there are pretty consistent from year-to-year. The most variable fire seasons happen elsewhere, such as the tropical forests of South America and equatorial Asia. In these areas, the severity of fire season is often linked to cycles of El Niño and La Niña. The buildup of warm water in the eastern Pacific during an El Niño changes atmospheric patterns and reduces rainfall over many rainforests, allowing them to burn more easily and widely.https://www.youtube.com/embed/69N494UIlS8?flag=1&enablejsapi=1&html5=1&origin=https://earthobservatory.nasa.gov
Despite the vast quantities of carbon released by fires in savannas, grasslands, and boreal forests, research shows that fires in these biomes do not generally add carbon to the atmosphere in the long term. The regrowth of vegetation or the creation of charcoal typically recaptures all of the carbon within months or years. However, when fires permanently remove trees or burn through peat (a carbon-rich fuel that can take centuries to form), little carbon is recaptured and the atmosphere sees a net increase in CO2.
That is why outbreaks of fire in countries with large amounts of peat, such as Indonesia, have an outsized effect on global climate. Fires in equatorial Asia account for just 0.6 percent of global burned area, yet the region accounts for 8 percent of carbon emissions and 23 percent of methane emissions. On October, 25, 2015, the Earth Polychromatic Imaging Camera aboard the DSCOVR satellite acquired an image (below) of heavy smoke over Indonesia; El Niño was particularly active at the time.
October 15, 2015
One of the most interesting things researchers have discovered since MODIS began collecting measurements, noted Randerson, is a decrease in the total number of square kilometers burned each year. Between 2003 and 2019, that number has dropped by roughly 25 percent.
As populations have increased in fire-prone regions of Africa, South America, and Central Asia, grasslands and savannas have become more developed and converted into farmland. As a result, long-standing habits of burning grasslands (to clear shrubs and land for cattle or other reasons) have decreased, explained NASA Goddard Space Flight scientist Niels Andela. And instead of using fire, people increasingly use machines to clear crops.
“There are really two separate trends,” said Randerson. “Even as the global burned area number has declined because of what is happening in savannas, we are seeing a significant increase in the intensity and reach of fires in the western United States because of climate change.”
2003 – 2015
When researchers began using satellites to study the world’s fires in the 1980s, they were just sorting out the basics of how to detect fires from space. Now after mining MODIS data for nearly two decades, scientists are looking ahead to other satellites and technologies that they hope will advance the study of fire in the coming years.
A series of follow-on sensors called the Visible Infrared Imaging Radiometer Suite (VIIRS) on the Suomi NPP and NOAA-20 satellites now make near-real time observations of emissions that are even more accurate than those from MODIS because of improved fire detections along the edge of the edges of images, noted Andela.
Meanwhile, the launch of satellites with higher-resolution sensors is also helping. “The Landsat 8 and Sentinel satellites, in particular, are contributing to a revolution in our ability to measure the burned area of small grassland and forest fires,” said Randerson. “And we are going to need additional detection capabilities in the coming years to track increasingly destructive mega fires during all times of day and night.”
September 12th 2020;
see the fall in Max temperature at Denver in 2 days !38c to 13c !
September 4th:
First super typhoon of the year has formed in NW pacific. Name: Haishen. As of 5:30am ISTIt has a windspeed of 135 knots, making it the second most powerful cyclone of the year in the northern hemisphere
Info from Vag. Vineetkumar (Pune IITM)
September 3rd 2020:
Maysak typhoon with maximum windspeed of 125 knots is the strongest typhoon and only the first category 4 typhoon in entire pacific ocean in year 2020.
Its lowest pressure: 921 hpa
Durration with windspeed more than 65 knots : 4.5 days. Highest by any typhoon in entire pacific ocean this year
Last night, Hurricane Laura made landfall on the southwestern coast of Louisiana, bring heavy rain (6-8 inches), strong winds (gusting to 132 mph at one location), and a coastal storm surge (roughly 10 feet at the most vulnerable locations).
The NWS Lake Charles radar image at midnight central time showed a well defined eye as the storm was making landfall.
Now the dilemma and interesting part. Based on reconnaissance aircraft and other information, the National Weather Service’s National Hurricane Center had estimated that Laura was a Category Four hurricane just prior to landfall, and according to the official Saffir-Simpson scale, that means the sustained surface (10-m) winds, averaged over a few minutes, were between 130 and 156 mph (see below). Not gusts, sustained winds.
Saffir-Simpson Hurricane Categories
But here is the issue. What were the maximum sustained winds that occurred last night as Laura made landfall? Looking at all available stations, the highest sustained wind was 98 mph at Lake Charles Airport. The map below shows the sustained winds at 1 AM, when the storm was just moving inland (wind barbs show sustained winds, with gusts in red). The blue arrow indicates Lake Charles Airport.
Looking at the sustained winds, one would conclude that Laura was only a weak category two hurricane (96-110 mph).
And then there are gusts. Gusts are not used as part of the Saffir-Simpson hurricane scale, but, let’s face it, gusts are very important. The big damage in most storms are done by the gusts.
Below are the maximum gusts of Laura. Two locations are extreme: Calcasieu Pass on the coast and Lake Charles, a few miles to the north (127 and 132 mph gusts, respectively)
Such strong gusts are consistent with the destruction of the NWS radar dome at Lake Charles Airport–they are rated to handle up to about 135 mph. (see the before and after below).
So what is going on? How strong was the storm? Category two or four?
A key issue is friction and drag, which is much greater over land (with trees, hills, buildings, etc) that over the aerodynamically smooth water. As a result of this surface drag, winds decrease VERY rapidly over land, even if the hurricane remains relatively intact aloft.
Let me illustrate this visually, by showing you a forecast by the state-of-the-art NOAA/NWS HRRR model as Laura made landfall. These plots show surface (10-m) surface wind in knots (1 knot=1.15 mph)
Before landfall (9 PM PDT), a nice hurricane structure is apparent, with some winds getting to 90 knots in the eyewall.
But then as the storm makes landfall (1 AM PDT), you can see a profound weakening of winds over land.
And by 5 AM PDT, with the storm completely over land, the fastest winds are gone.
So even if the storm had category four sustained winds near the surface while it is offshore, the sustained winds decline precipitously when the store goes onshore.
But yet the storm can still remain very, very dangerous in the hours after landfall. Why?
First, even the reduced sustained winds (e.g., 90-100 mph in this case) can produce great damage.
But there is more. Gusts don’t necessarily decline as rapidly as sustained winds as the storm moves over land.
To illustrate this, here is a plot of the predicted gusts as the storm made landfall. Not as much a decline over land as for sustained winds. Gusts are caused by the intermittent mixing down of faster (higher momentum) air from aloft down to the surface. So even if winds are slower down lower, sometimes air from aloft…where the winds are still blowing hard…can be mixed to the surface. So gusts can hold out longer than sustained winds as a storm makes landfall.
The bottom line: a storm that was category four over water can still maintain a real “punch” over land, even after it nominally declines to a category two. Strong, damaging gusts can remain, even when the sustained winds decline.
28th august 2020 :Phoenix Has Record-Breaking Heat Wave With 50 Days Of 110°F...43.3c
Phoenix, Arizona Is In The Midst Of An Unprecedented Record-Breaking Heat Wave, Hitting Its 50th Day This Year With Temperatures Reaching 110 Degrees Or Higher On Friday.
Although scorchingly hot summer temperatures are common in the desert city, the current year has broken earlier records for consistently high temperatures by some distance. The previous record for the most days at 110 degrees or higher in one year was 33, which occurred in 2011.
On August 16, a temperature of 130 degrees was recorded at California’s Death Valley. The reading was the third-highest temperature ever recorded. The highest-ever temperature was also recorded at Death Valley, where a temperature of 134 degrees was observed on June 10, 1913, while 131 degrees was recorded in Tunisia on July 7, 1931.
Tokyo (CNN)Temperatures in central Japan tied for a national record on Monday, as the country sweltered under a scorching summer heat wave.
The mercury rose to 41.1 degrees Celsius (105.98 degrees Fahrenheit) in the central city of Hamamatsu, in Shizuoka prefecture on Monday, according to the Japan Meteorological Agency, matching the highest temperature ever recorded in the country, which was set in Kumagaya, a city near Tokyo, in July 2018.
Japan has been enduring an intense heatwave since the middle of last week, with multiple cities and prefectures nearing 40°C (104°F) for several consecutive days.
To compare, the average daytime temperature in August for Hamamatsu between 1898 and 2010 was 31.3°C (88.34°F), the JMA said. Last year, average temperatures in Japan reached the highest level since records began in 1898, and were almost a degree warmer than a typical year, according to the JMA.
"Monday was a scorching hot day (like) I've never experienced, I was wearing a mask outside and drenched in sweat in the heat," said Satoru Shoji, who works at the Hamamatsu tourism office.
On Monday, cities in Nagano, Gifu, Nara, Kochi and Miyazaki prefectures -- covering central and southwestern Japan -- saw temperatures above 39°C (102.2°F).
Residents in the capital Tokyo broiled in 36.5°C weather, and have endured three straight days of temperatures above 35°C. Meanwhile, Osaka posted a high of 37.1°C (98.7°F) on Monday, and the popular tourist town of Kyoto reached 38.7°C (101.6°F)
Australian meteorologists took note recently when not one—but two—vast bands of clouds stretched from the eastern Indian Ocean to Australia, channeling streams of moisture that delivered intense rains to both sides of the continent.
Moisture-transporting atmospheric rivers occur all over the world and regularly hit Australia, but it is rare for two of the rainmakers to hit at once, according to Australia’s Bureau of Meteorology. One of them delivered more than 150 millimeters (6 inches) of rain in less than 24 hours to Western Australia’s Nullabar Coast, a dry area that typically receives 24 millimeters of rain in the whole of August. The second system dropped large volumes of rain on New South Wales.
Atmospheric rivers are often called Northwest Cloud Bands in Australia. The same type of event in the United States is colloquially called the Pineapple Express, because it brings moisture from the tropical Pacific near Hawaii to the U.S. West Coast.
There are some indications that the frequency of atmospheric rivers could be increasing as global climate changes. After searching through 30 years of satellite data (1984-2014) for Northwest Cloud Bands affecting Australia, a team of University of Melbourne researchers concluded that the number of cloud band days had increased by nearly one day per year over the study period.
Tourists walk in the Mesquite Dunes of Death Valley National Park, Calif., in 2013. A weather station at the park recorded a temperature of 54.4 C Sunday, the hottest temperature in the world in more than 100 years. (REUTERS)
"If verified, this will be the hottest temperature officially verified since July of 1913," NWS Las Vegas, which owns the automated observation system, said of the reading on Sunday afternoon, emphasizing that it was preliminary.
It will need to undergo a formal review before the record is confirmed because of its significance, NWS said on its Twitter feed, linking to a statement.
Death Valley high temperature record of July 10, 1913
From "Whatts up with That"
*On July 10,Temperature recordings at the Greenland Ranch weather station in Death Valley, California during the intense heat wave of July 1913. This excerpt about the record-breaking heat wave comes from an article posted during January 1922 in the meteorological journal Monthly Weather Review which is still in publication today. Source: NOAA1913, Death Valley, California reached an amazing 134 degrees…the hottest temperature ever reliably recorded in a year with many remarkable weather events*
The high temperature in Death Valley, California on Friday will come close to 120°F, but this is still well short of the all-time record there that occurred way back in 1913. On July 10th, 1913, the weather observer at Greenland Ranch in Death Valley recorded a high temperature of 134°F. One hundred and seven years later, this is still the highest air temperature ever reliably recorded on Earth. In addition to this all-time and worldwide high temperature record, the year of 1913 produced numerous other extreme weather events.
The intense heat of July 1913 in California was not the only extreme heat measured that year in the US. There was a widespread heat wave in June of that same year across the eastern half of the nation which resulted in many readings above 100°F. In fact, NOAA’s official temperature records still cite June 16, 1913 as the hottest ever on a nationwide basis for that particular date. In addition to the excessive heat seen across the US that year, there are newspaper articles from that same time period suggesting high heat may have taken place in others part of the world.
On September 12th, 2012, the WMO officially re-certified the 134 degree reading of July 10th, 1913 at Death Valley, California as the all-time highest air temperature ever recorded on Earth after evidence surfaced suggesting the Libya record of 136°F was based on a reading from a bad thermometer that was placed in the wrong place (near asphalt) and read by an untrained observer
Hottest Day Ever in Australia Confirmed: Bourke 51.7°C, 3rd January 1909
From "Whatts up with That"
The Australian Bureau of Meteorology deleted what was long regarded as the hottest day ever recorded in Australia – Bourke’s 125°F (51.7°C) on the 3rd January 1909. This record* was deleted, falsely claiming that this was likely some sort of ‘observational error’, as no other official weather stations recorded high temperatures on that day.Australian Bureau of Meteorology deleted what was long regarded as the hottest day ever recorded in Australia – Bourke’s 125°F (51.7°C) on the 3rd January 1909. This record* was deleted, falsely claiming that this was likely some sort of ‘observational error’, as no other official weather stations recorded high temperatures on that day.
Photograph of the the relevant page from the observations book, and it shows 123°F was recorded at 9am on the morning of Monday 4th January 1909 – published here for the first time. This was the highest temperature in the previous 24 hours and corroborates what must now be recognised as the hottest day ever recorded in Australia of 51.7°C (125°F) degrees at Bourke on the afternoon of Sunday 3rd January 1909.
photographed by Craig Kelly MP. Note 123F recorded at 9am on 4th January 1909.
There have a lot of complaints about our cloudy weather of the past month--and it has been a bit depressing.
Yes, western Washington typically "enjoys" a cloudy, June gloom this time of the year, as high pressure builds over the eastern Pacific, pushing cloudy marine air up to the Cascade crest.
June 29th
Has this year been particularly bad? The essential answer: Yes, but not by a lot.
We can start with the total monthly radiation reaching the ground in Seattle at the WSU AgWeather site near the UW, which only goes back to 2012. June 2020 was the darkest June since 2012--eight years. June 2015, when high pressure dominated our region, was far brighter. 2012 was abysmal.
A polar vortex packing bone-chilling temperatures is turning the usually mild Mother's Day weekend into a preview of winter, bringing snow flurries to Manhattan on Saturday and even 10 inches of snow to northern New England.
The powerful stream of cold air, which normally confines itself to the Arctic, slipped southward instead and brought frigid temperatures and un-springlike snow to Canada and the eastern two-thirds of the United States.
The National Weather Service says the cold-air blast will hit the Eastern, Central and Southern U.S. during the weekend, with some snow from the Midwest to the Appalachians.
Some higher elevations in northern New York and New England reported snowfall accumulations Saturday of up to 10 inches, while traces of snow were seen along the coast from Maine to Boston to as far south as Manhattan.
New York City got in on the action early, with about a half-hour of snow early Saturday. That tied the record, set in 1977, for the latest date in spring snow was documented in Central Park, according to the NWS.
Detroit, Pittsburgh and New York City's Central Park also posted records low for the day, according to AccuWeather. Washington, D.C., with an overnight low of 37, smashed a 54-year-old record for the lowest day in May. The nation's capital was also flirting with a new record for the coldest high temperature for the day — 52 degrees — set in 1877
Can Meteorologists Help Epidemiologists with Coronavirus?
From Cliff Mass Weather Blog.
Meteorologists involved in the large U.S. numerical weather prediction community. And perhaps
meteorologists can help epidemiologists and the U.S. government to get a handle on the coronavirus situation.
Now don't take this blog as one uppity weather guy trying to give advice "outside his lane." A published paper in the Journal of Infectious Diseases (2016), said much of the same, with the authors noting the huge similarities in the work meteorologists and epidemiologists do and suggesting that the epidemiological community is roughly 40 years behind the numerical weather prediction enterprise. They observed that both epidemiological and numerical weather prediction models are attempting to simulate complex systems with exponential error growth, and thus have great sensitivity to initial conditions. So perhaps the experience of meteorologists, who spend much of their time thinking about how to improve weather forecasting, may be relevant to the current crisis.
The First Step in Prediction: Describing the Initial State of the System To predict the future you need to know what is happening now. The better you can describe the initial starting point of forecasts, the better the forecast. Meteorologists have spent 3/4 of a century on such work, first with surface observations and balloon-launched radiosondes, and later with radars and satellite observations. Billions have been invested in the weather observing system, which gives us a three-dimensional observational description of atmospheric structure. Big data. And we have learned how to quality control and combine the data with complex data assimilation techniques, with the resulting description of the atmosphere immensely improving our predictions. This work is completed operationally by large, permanent groups such as NOAA and NASA, with large interactions with the research community.
Contrast this to the unfortunate state of epidemiologists predicting the future of the coronavirus.
They have very little data on what is happening now. They don't know who in the population is currently infected or has been infected. They don't even know the percentage of the current population that is infected. Without such information, there is no way epidemiologists can realistically simulate the future of the pandemic. They are trying, of course, but the results have been disappointing.
Meteorologists use complex, full-physics models comprised of equations that predict the future evolution of the atmosphere. Then we apply statistical corrections to make the forecasts even better.
The meteorological community has a long and successful track record in an analogous enterprise, showing the importance of massive data collection to describe the environment you wish to predict, the value of sophisticated and well-tested models to make the prediction, and the necessity to maintain a dedicated governmental group that is responsible for state-of-science prediction. Perhaps this approach should be considered by the infectious disease community. and the experience of the numerical weather prediction community might be useful.
Denver International Airport set a record low temp yesterday of 12F, according to the National Weather Service. The previous low temp for April 17 of 13F was set in 1901.
DIA also set a record low on Thursday when reaching 19 degrees, breaking the old record of 22 degrees.
On Thursday, Northern Colorado was on a Winter Storm Warning with 14 inches of snowfall in Fort Collins and 12 inches in Denver.
Violent eruption propels ash to 47,000 ft (15 km) altitude
10 Apr 2020 – The famous volcano, located between the islands of Java and Sumatra in the Indonesian province of Lampung, reportedly began erupting at 10:35 p.m. local time.
“Krakatau is erupting nonstop for 2 hours,” one social media user posted. “I live in Bogor and I can hear the noises as clear as everybody else hear. This feels like a nightmare”.
The volcano’s rumble was heard very clearly in West Java and Indonesia’s capital of Jakarta.
Satellite images picked up a large magmatic eruption of ash and plume propelled into the sky.
View from Webcam
According the The Express, the eruption was “relatively small”, with less material thrown high than in previous eruptions.
It's Bizarre: March was Colder than January In Seattle
Everything seems topsy turvy and unnatural these days, and there is a meteorological oddity that must be added to the list:
March was cold than January in Seattle this year.
I knew March was a cool one, but it was not until Dr. Joseph Zagrodnik, a talented atmospheric scientist working at WSU's AgWeatherNet organization, pointed in out to me, did I realize how unusual the past month had been.
According to Dr. Zagrodnik, the average temp in March at Sea-Tac Airport was 44.8 degrees F compared to 45.1 F in January.
How unusual is this? Rare, but not unprecedented. March has been cooler than January 8 times in the 126 years we have temperature records in Seattle, with the last time it occurred in 2006.
To appreciate this oddity visually, the graph below shows the numbers of year the March minus January temperatures fell in various bins. On average, March is about 5F warmer than January, but in some extreme years March has been as much as 17F warmer. That would get folks attention. Ten years were close to zero (within .5F of zero) and only a handful (3) were .5 to 1.5F cooler in March.
Another way to appreciate our cool March would be to look at a map of the difference of this year's March temperature from normal (see below). Western Washington was much cooler than normal, with some areas 4-5F cooler than typical values. More normal temperatures east of the Cascade crest.
I know your next question: Why? A good question. It has to do with an unusual weather pattern that has persisted over the North Pacific during the past month, one that includes a ridge of high pressure offshore with persistent cool, northerly flow over the Northwest.
The figure below shows the height (like pressure) anomalies (difference from normal) around 18,000 ft above the surface (500 h Pa pressure). Unusually high heights offshore (red) and lower than normal heights (blue/purple). This is a cold pattern for us, with unusually strong/cold northerly flow over the Northwest coast.
Finally, I wanted to show you an extraordinary picture taken yesterday (Wednesday) around 5:20 PM from the Seattle SpaceNeedle PanoCam. With cold air aloft and great instability, there was a magnificent line of cumulus clouds along the western slopes of the Cascades. Just stunning.
Popocatépetl (Central Mexico): Explosive activity continues. Volcanic Ash Advisory Center (VAAC) Washington warned about a volcanic ash plume that rose up to estimated 22000 ft (6700 m) altitude or flight level 220 . The full report is as follows: VA EM OBS IN STLT. to 22000 ft (6700 m)
Nevado del Ruiz (Colombia): Explosive activity continues. Volcanic Ash Advisory Center (VAAC) Washington warned about a volcanic ash plume that rose up to estimated 22000 ft (6700 m) altitude or flight level 220 . The full report is as follows: VA EM RPRTD. to 22000 ft (6700 m)
Sangay (Ecuador): (28 Mar) Explosive activity continues. Volcanic Ash Advisory Center (VAAC) Washington warned about a volcanic ash plume that rose up to estimated 22000 ft (6700 m) altitude or flight level 220 and is moving at 10 kts in SW direction.
Scientists recording the first-ever heatwave event in Antarctica over the 2019-20 summer period. Researchers from the Australian Antarctic Program recorded the heat wave at the Casey Research Station — located on the northern part of Bailey Peninsula on the Budd Coast — between January 23 and 26, which falls in the region’s summer season.During the three days, minimum temperatures climbed above zero, and maximum temperatures reached above 7.5 degrees Celsius. On January 24, its highest maximum of 9.2°C was recorded, almost 7°C above Casey’s 30-year mean for the month.
“Heatwaves are classified as three consecutive days with both extreme maximum and minimum temperatures,” University of Wollongong biologist Sharon Robinson explained.
“In the 31-year record for Casey, maximum temperature of 9.2 degrees Celsius is 6.9 degrees Celsius higher than the mean maximum temperature for the station, while the minimum is 0.2 degrees Celsius higher,” Robinson said.
31st March 2020
Messgae from Maximiliano from Thailand :
"Hallo Rajesh
Hottest T ever of March in THailand 42.9C yesterday and today recorded at Thoen.
Also hottest March ever nationwide as always.
Every month Thailand is setting records heat,never been below average not even a single day of the year.
Heat indexes are expected to rise around 70C next weeks."
Earth’s third-highest summit, Kanchenjunga, rises more than 8500 meters above sea level along the border of Nepal and India.
Image of the Day for March 29, 2020
31st March 2020
Last Friday, 20th March 2020, Antarctica set a record for its coldest March temp ever recorded, not just for the day, but for the entire month.
The Vostok Station clocked a bone-chilling -75.3C (-103.54F) on the morning of Friday, March 20, as spotted by @TempGlobal on Twitter:
Antarctica Melts Under Its Hottest Days on Record
On February 6, 2020, weather stations recorded the hottest temperature on record for Antarctica. Thermometers at the Esperanza Base on the northern tip of the Antarctic Peninsula reached 18.3°C (64.9°F)—around the same temperature as Los Angeles that day. The warm spell caused widespread melting on nearby glaciers.
The warm temperatures arrived on February 5 and continued until February 13, 2020. The images above show melting on the ice cap of Eagle Island and were acquired by the Operational Land Imager (OLI) on Landsat 8 on February 4 and February 13, 2020.
The heat is apparent on the map below, which shows temperatures across the Antarctic Peninsula on February 9, 2020. The map was derived from the Goddard Earth Observing System (GEOS) model, and represents air temperatures at 2 meters (about 6.5 feet) above the ground. The darkest red areas are where the model shows temperatures surpassing 10°C (50°F).
Mauri Pelto, a glaciologist at Nichols College observed that during the warming event, around 1.5 square kilometers (0.9 square miles) of snowpack became saturated with meltwater (shown in blue above). According to climate models, Eagle Island experienced peak melt—30 millimeters (1 inch)—on February 6. In total, snowpack on Eagle Island melted 106 millimeters (4 inches) from February 6- February 11. About 20 percent of seasonal snow accumulation in the region melted in this one event on Eagle Island.
“I haven’t seen melt ponds develop this quickly in Antarctica,” said Pelto. “You see these kinds of melt events in Alaska and Greenland, but not usually in Antarctica.” He also used satellite images to detect widespread surface melting nearby on Boydell Glacier.
Pelto noted that such rapid melting is caused by sustained high temperatures significantly above freezing. Such persistent warmth was not typical in Antarctica until the 21st century, but it has become more common in recent years.
The warm temperatures of February 2020 were caused by a combination of meteorological elements. A ridge of high pressure was centered over Cape Horn at the beginning of the month, and it allowed warm temperatures to build. Typically, the peninsula is shielded from warm air masses by the Southern Hemisphere westerlies, a band of strong winds that circle the continent. However, the westerlies were in a weakened state, which allowed the extra-tropical warm air to cross the Southern Ocean and reach the ice sheet. Sea surface temperatures in the area were also higher than average by about 2-3°C.
Dry, warm foehn winds also could have played a part. Foehn winds are strong, gusty winds that cause downslope windstorms on mountains, often bringing warm air with them. In February 2020, westerly winds ran into the Antarctic Peninsula Cordillera. As such winds travel up the mountains, the air typically cools and condenses to form rain or snow clouds. As that water vapor condenses into liquid water or ice, heat is released into the surrounding air. This warm, dry air travels downslope on the other side of the mountains, bringing blasts of heat to parts of the peninsula. The drier air means fewer low-lying clouds and potentially more direct sunlight east of the mountain range.
“Two things that can make a foehn-induced melt event stronger are stronger winds and higher temperatures,” said Rajashree Tri Datta, an atmospheric researcher at NASA’s Goddard Space Flight Center. With warmer air in the surrounding atmosphere and ocean, the conditions were conducive this month for a foehn wind event.
This February heatwave was the third major melt event of the 2019-2020 summer, following warm spells in November 2019 and January 2020. “If you think about this one event in February, it isn’t that significant,” said Pelto. “It’s more significant that these events are coming more frequently.“


 An oblique photo from the International Space Station captured haze spilling from valleys in Italy and France and streaming south along the Italian peninsula.
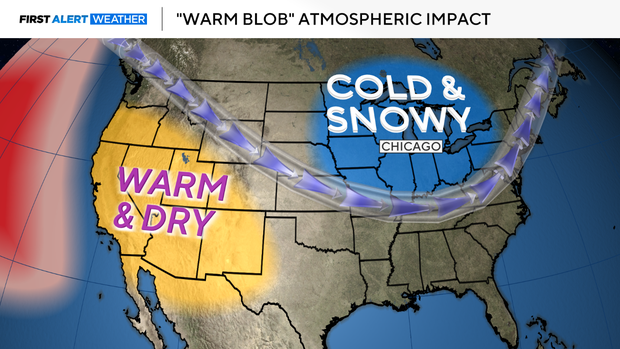


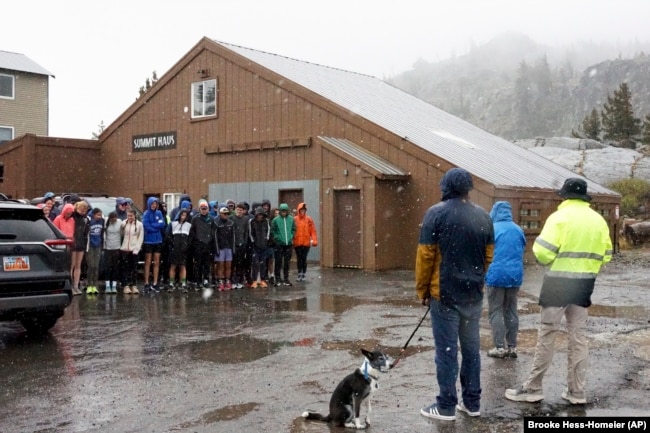
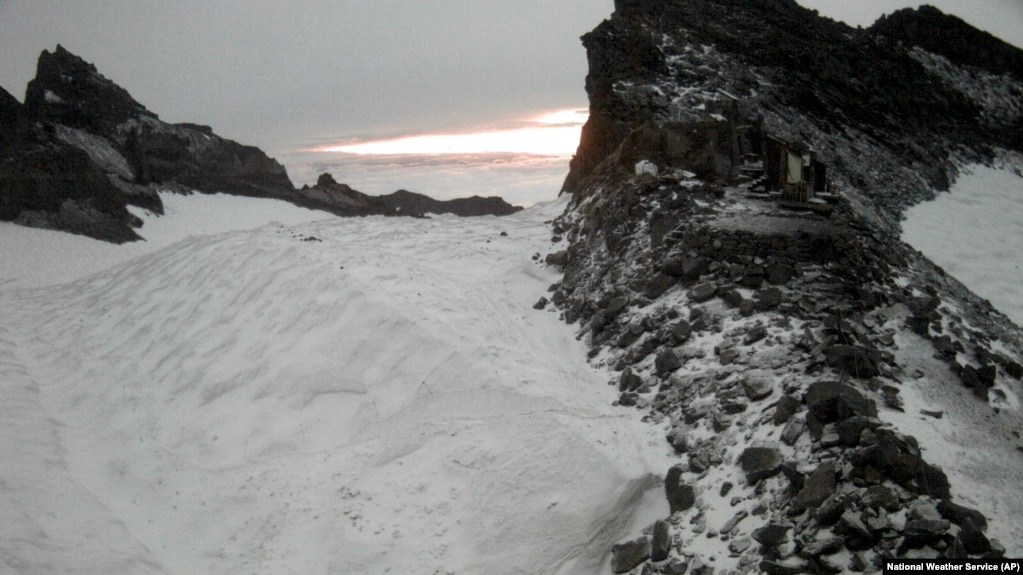

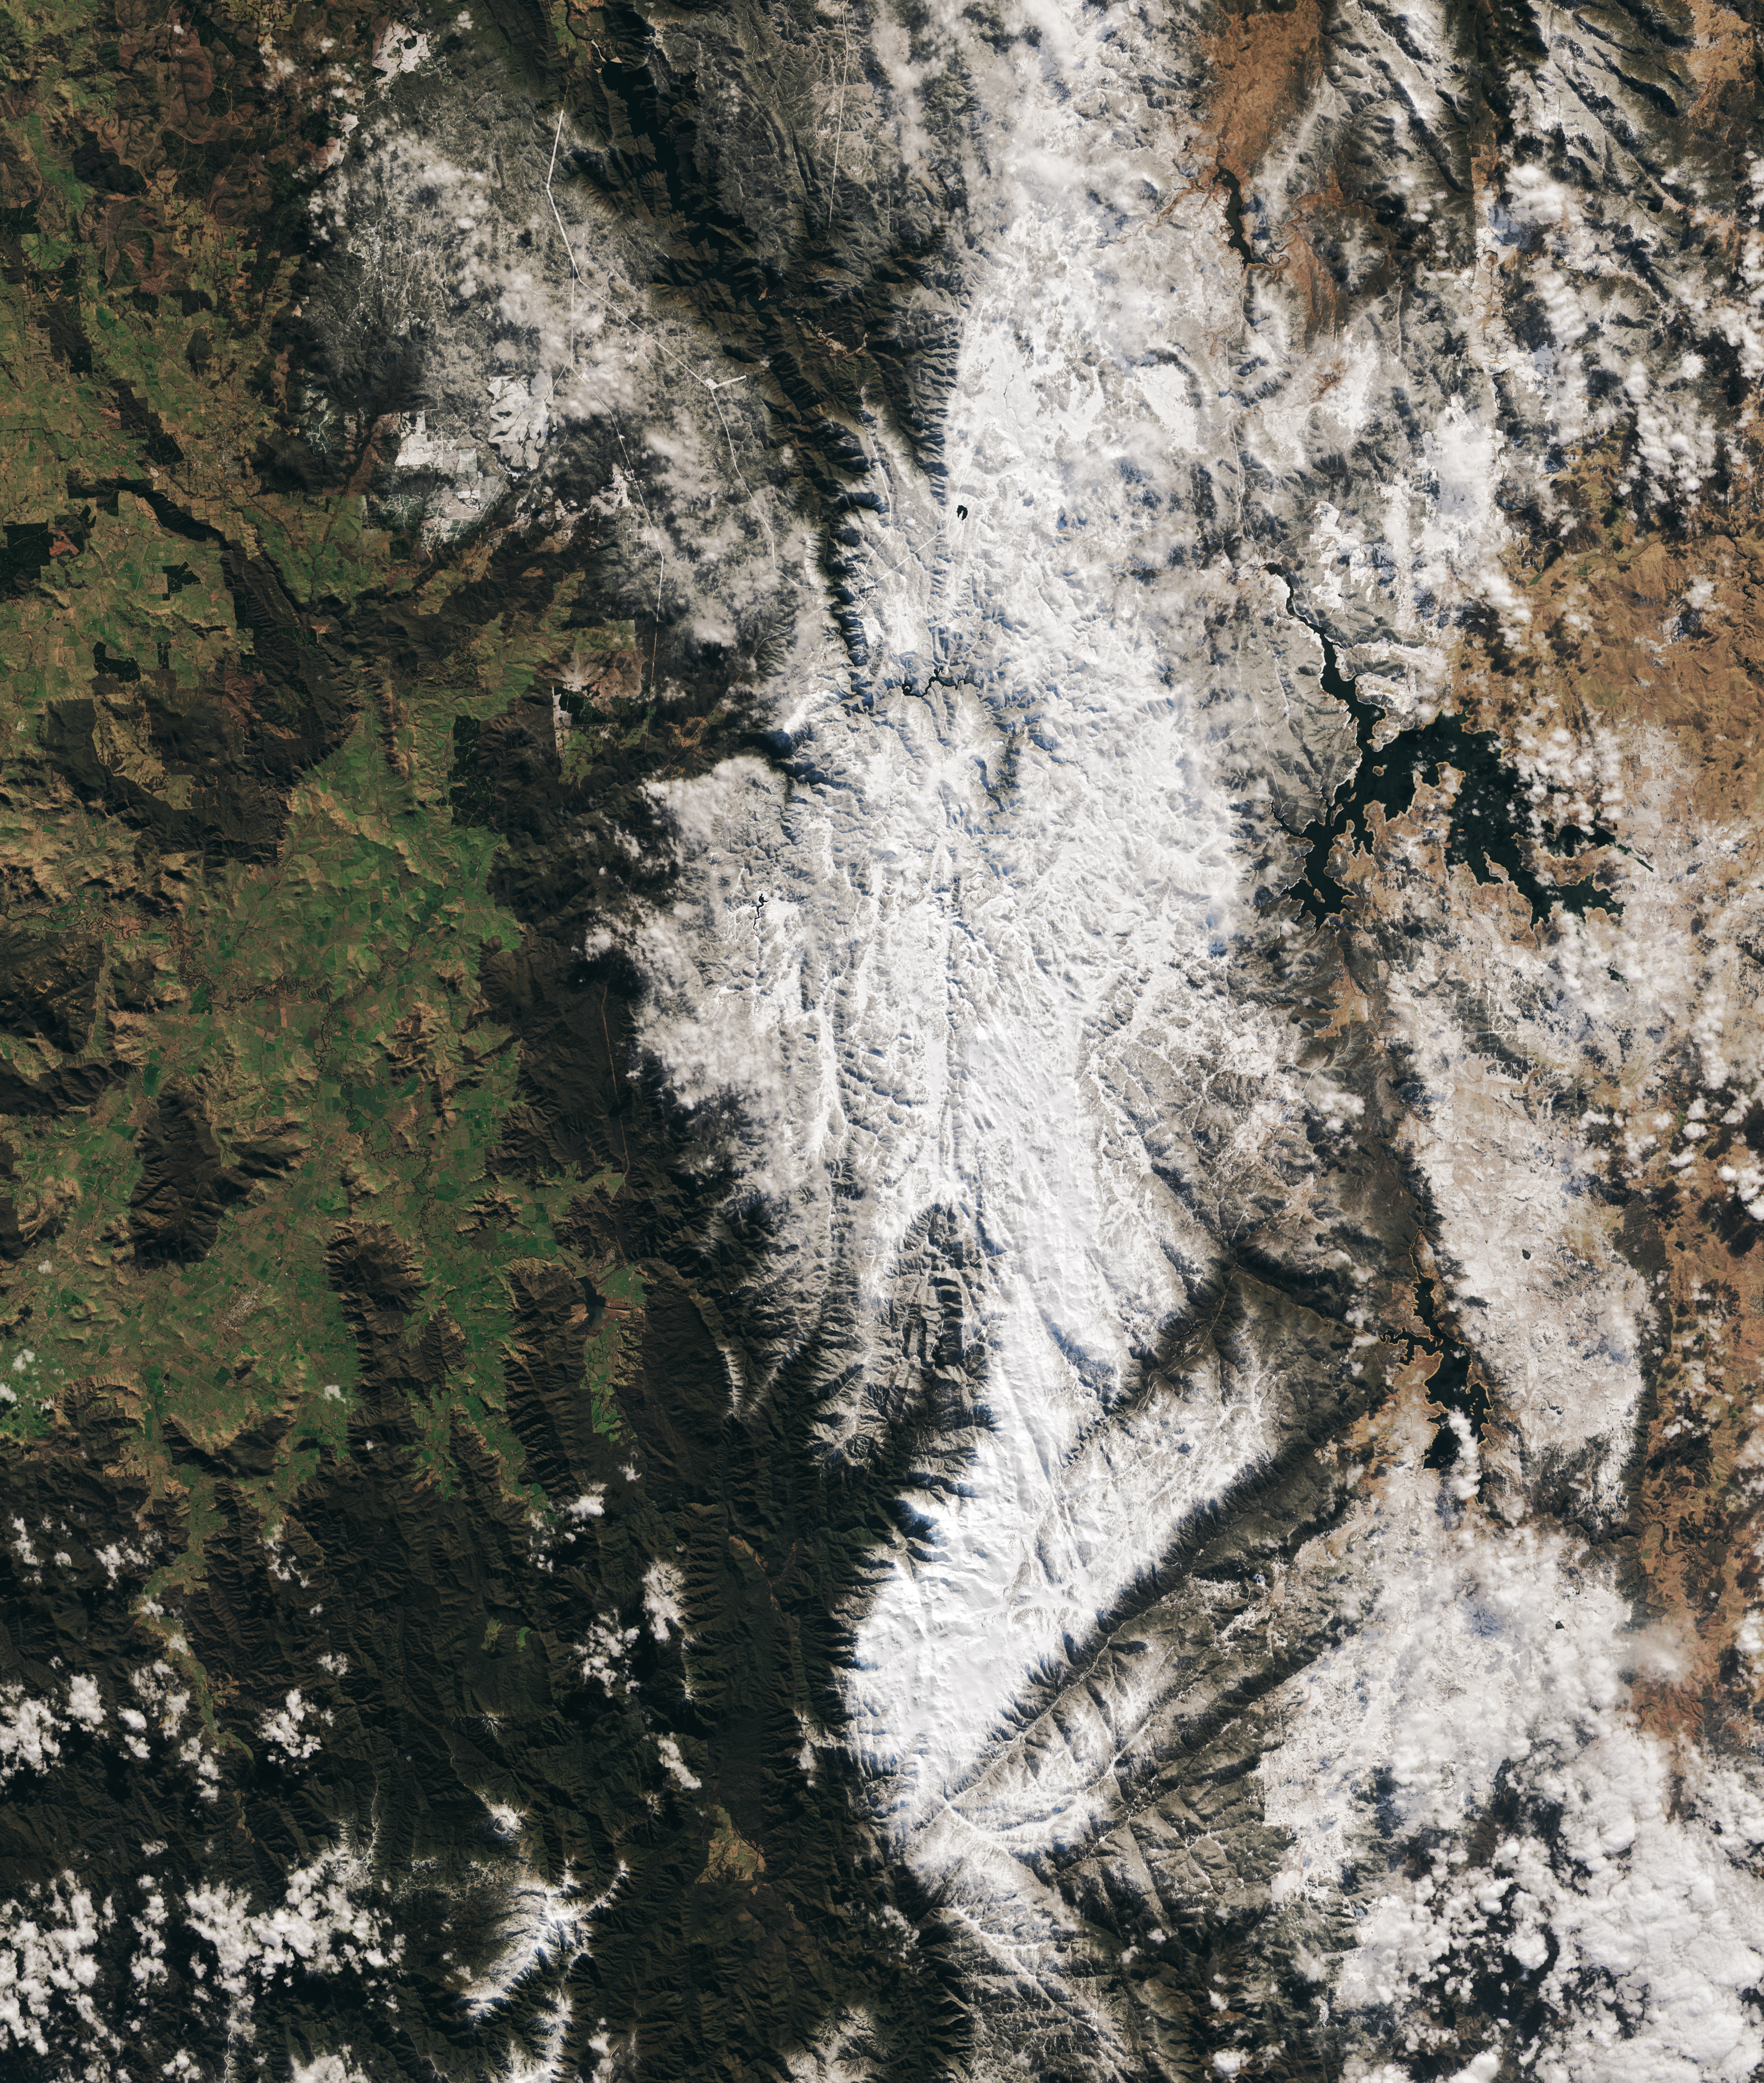


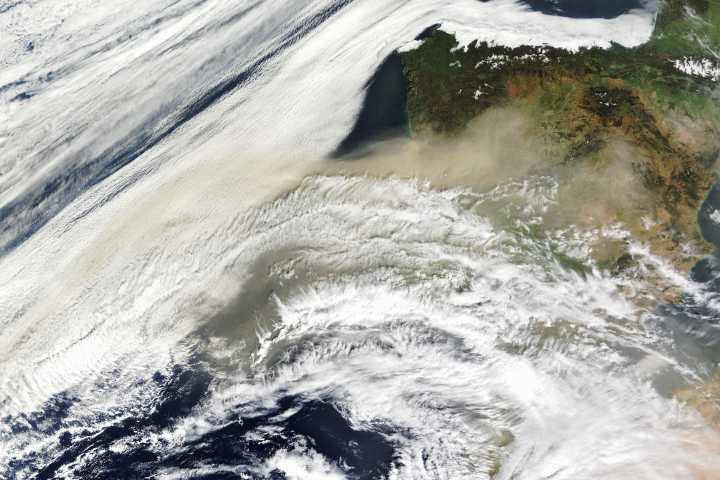


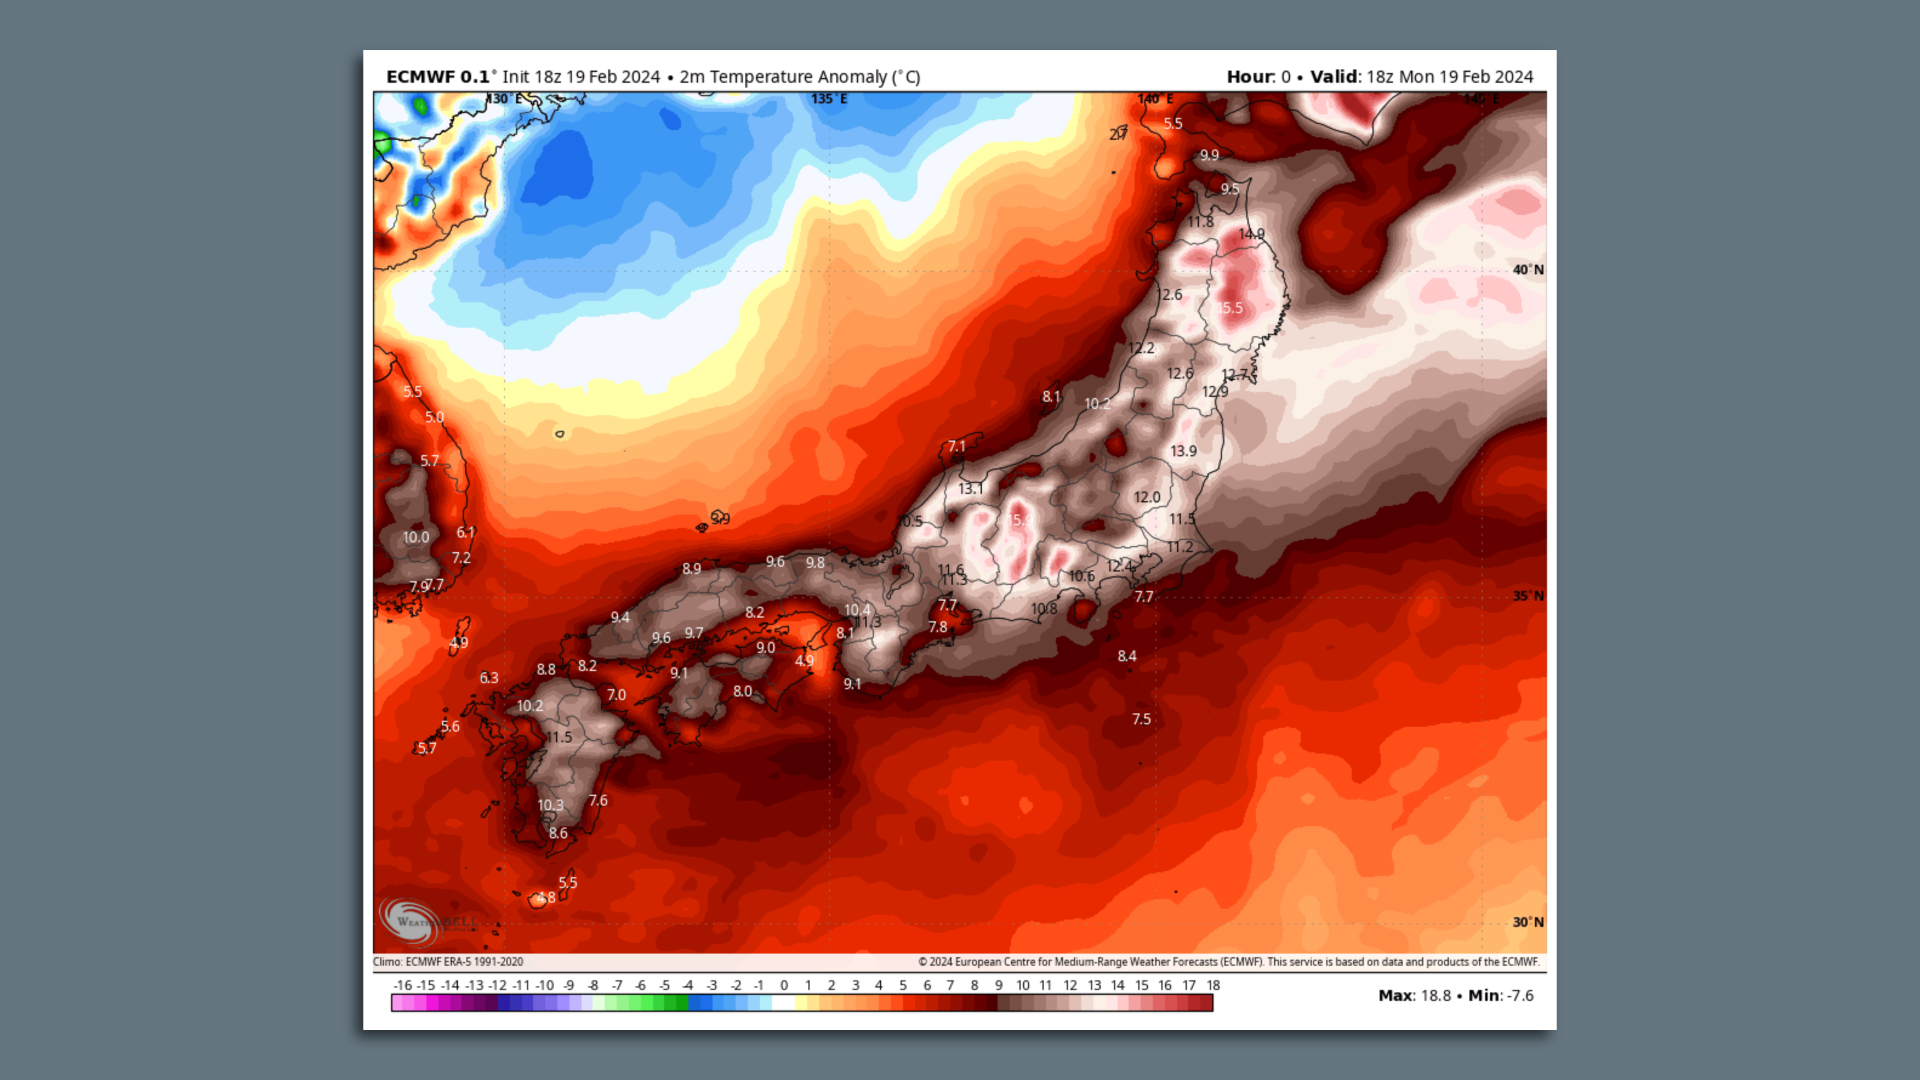


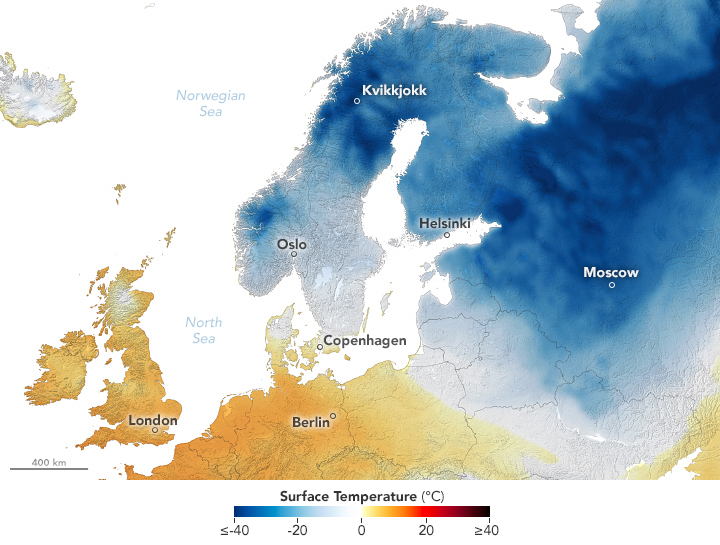
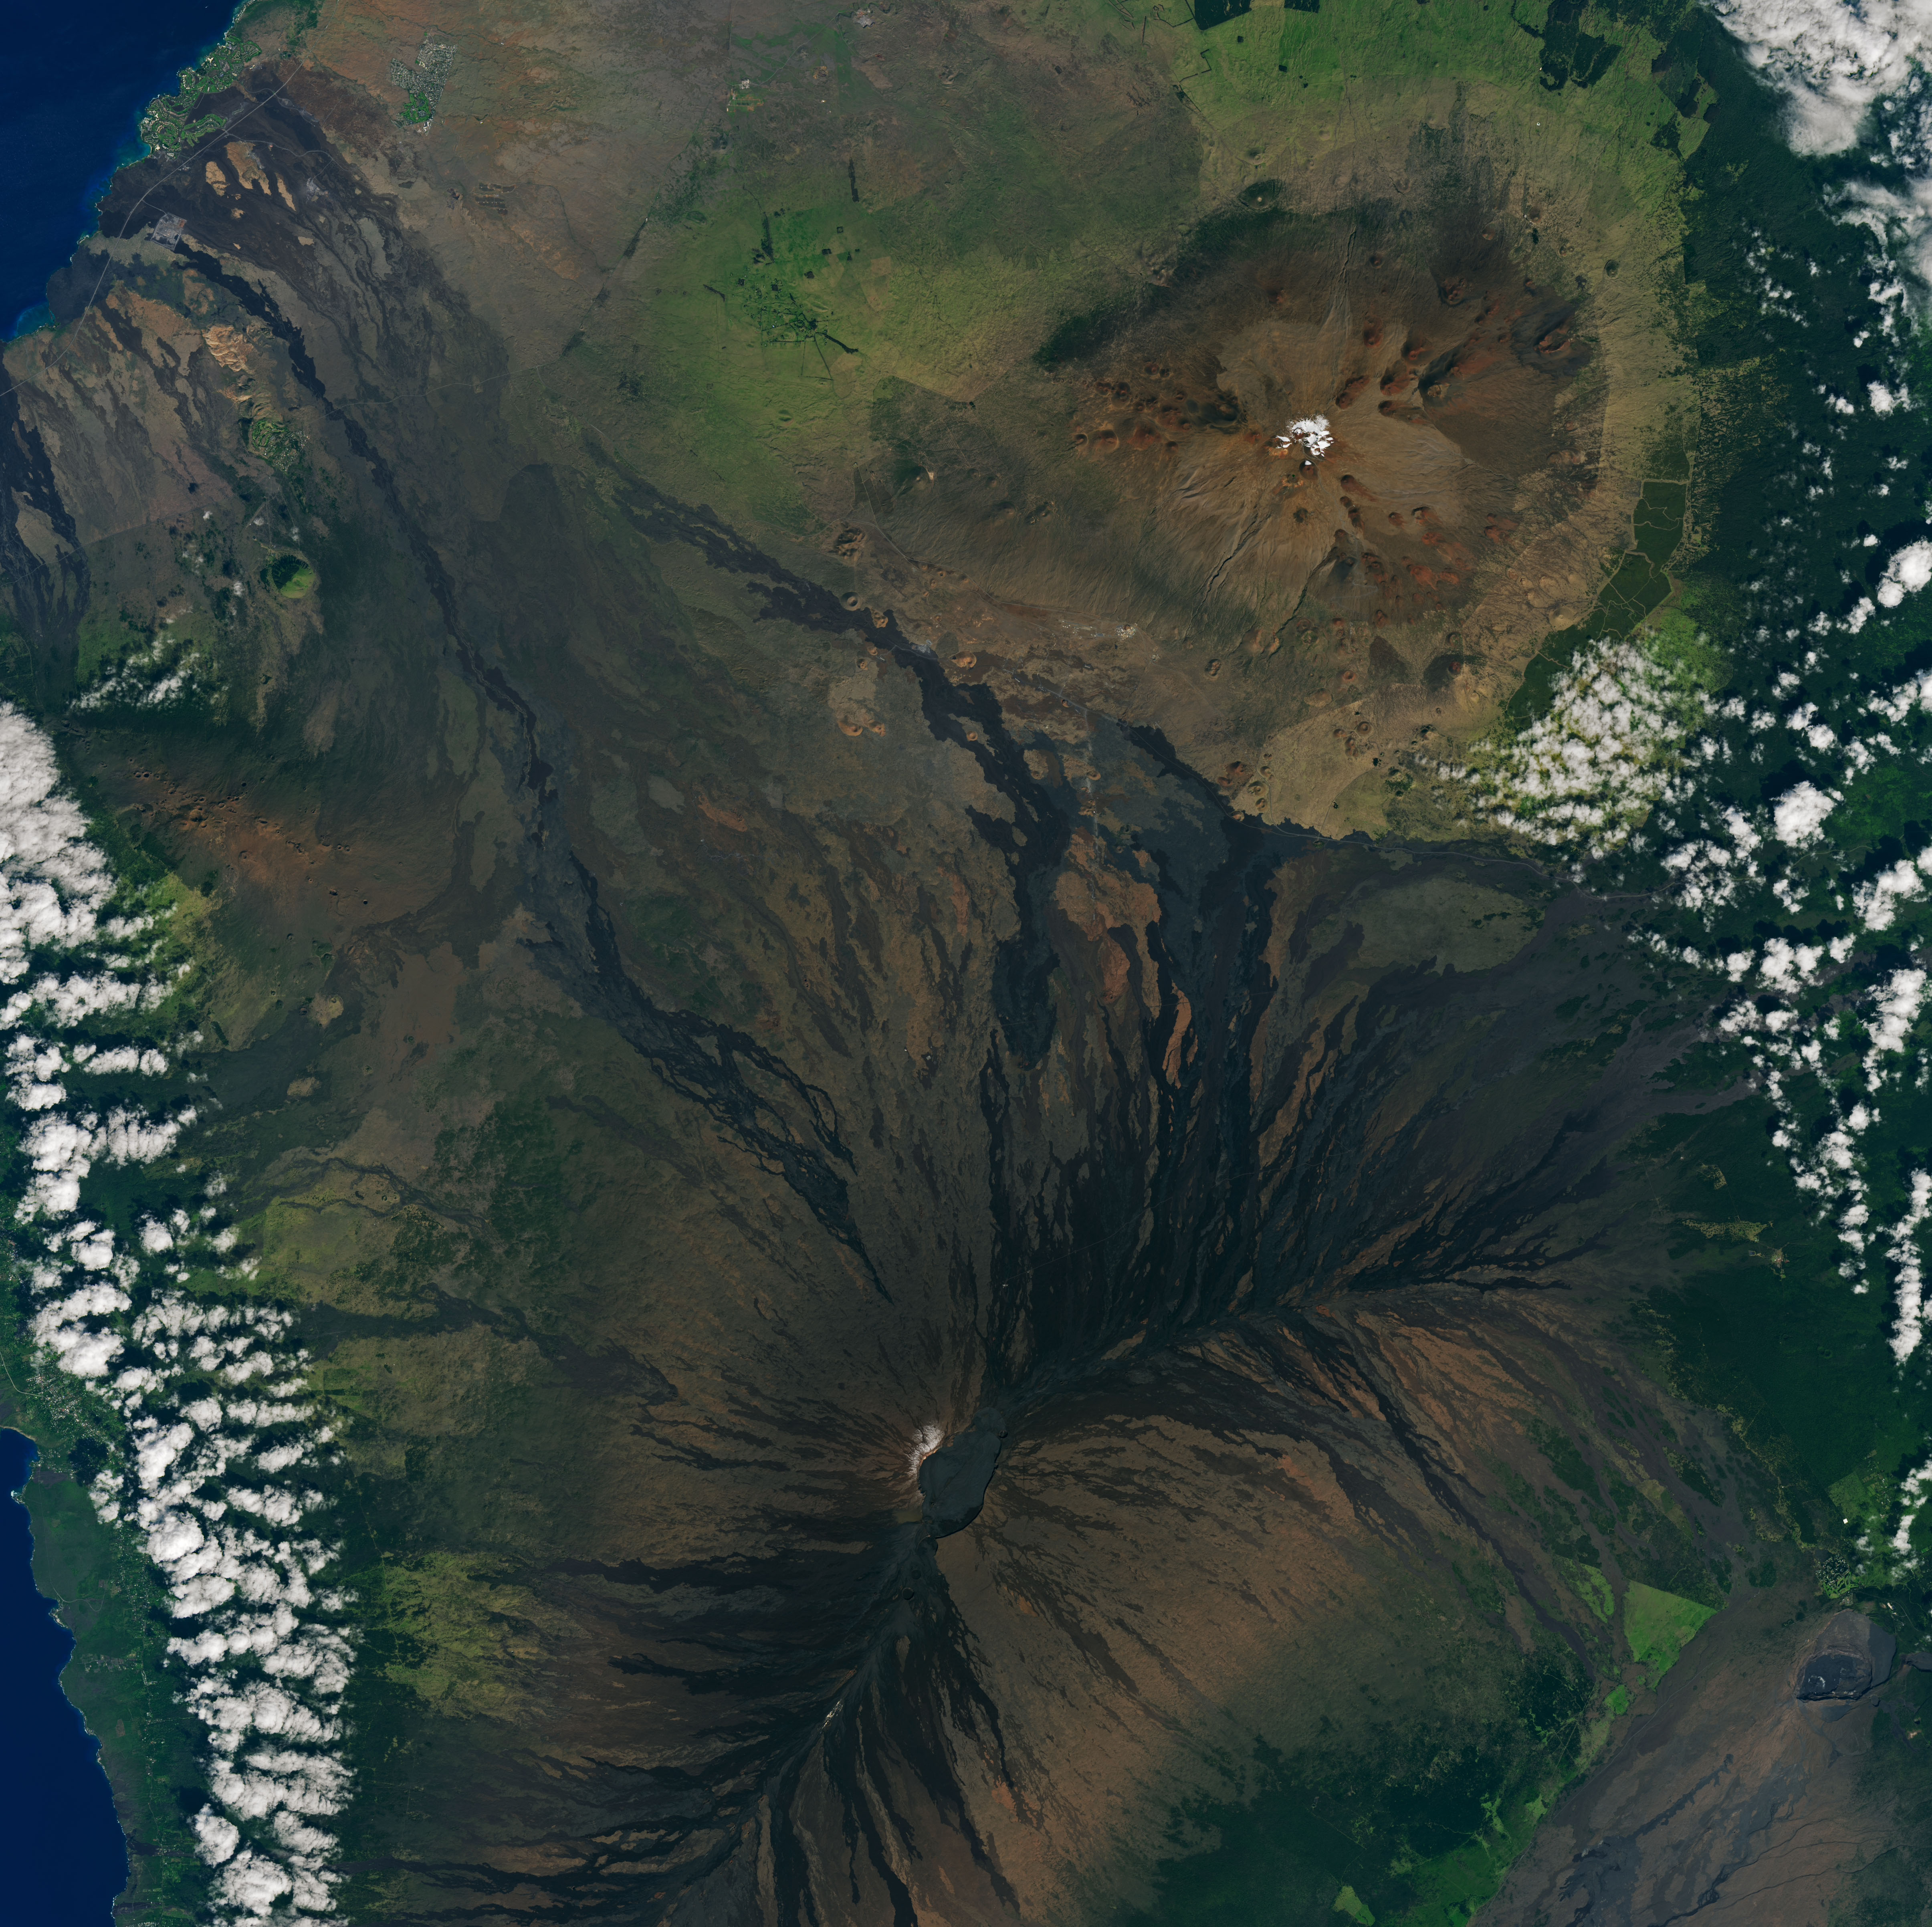
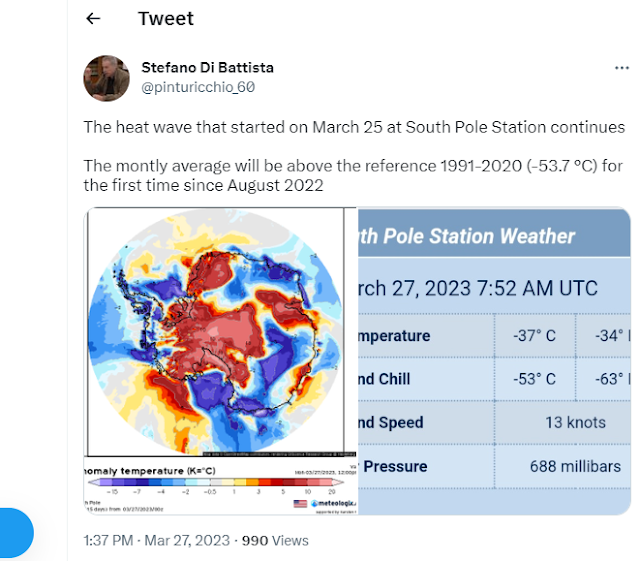


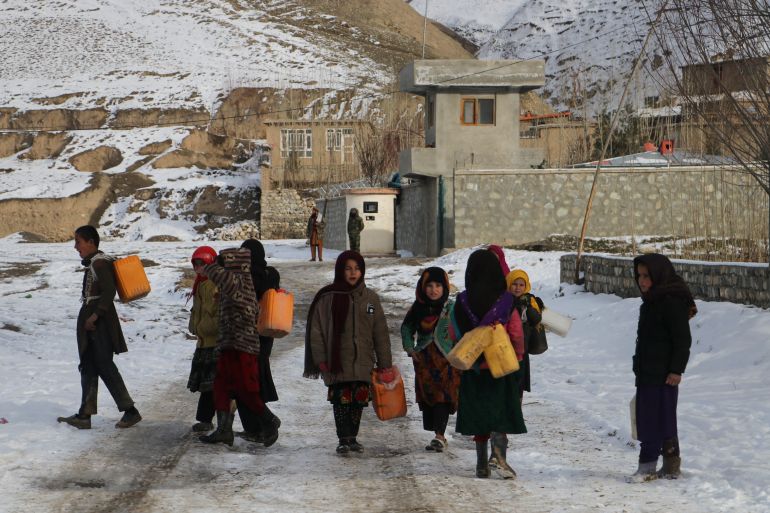


 London coated in first snow of winter after cold snap
.png)


.png)

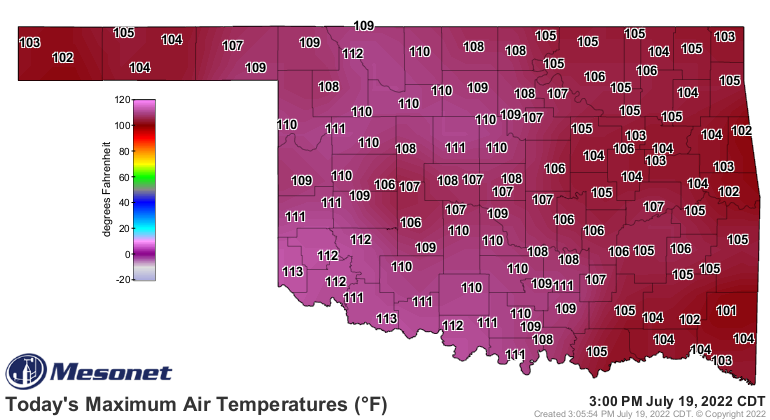

.png) click on Picture for enlarged view
click on Picture for enlarged view.png)


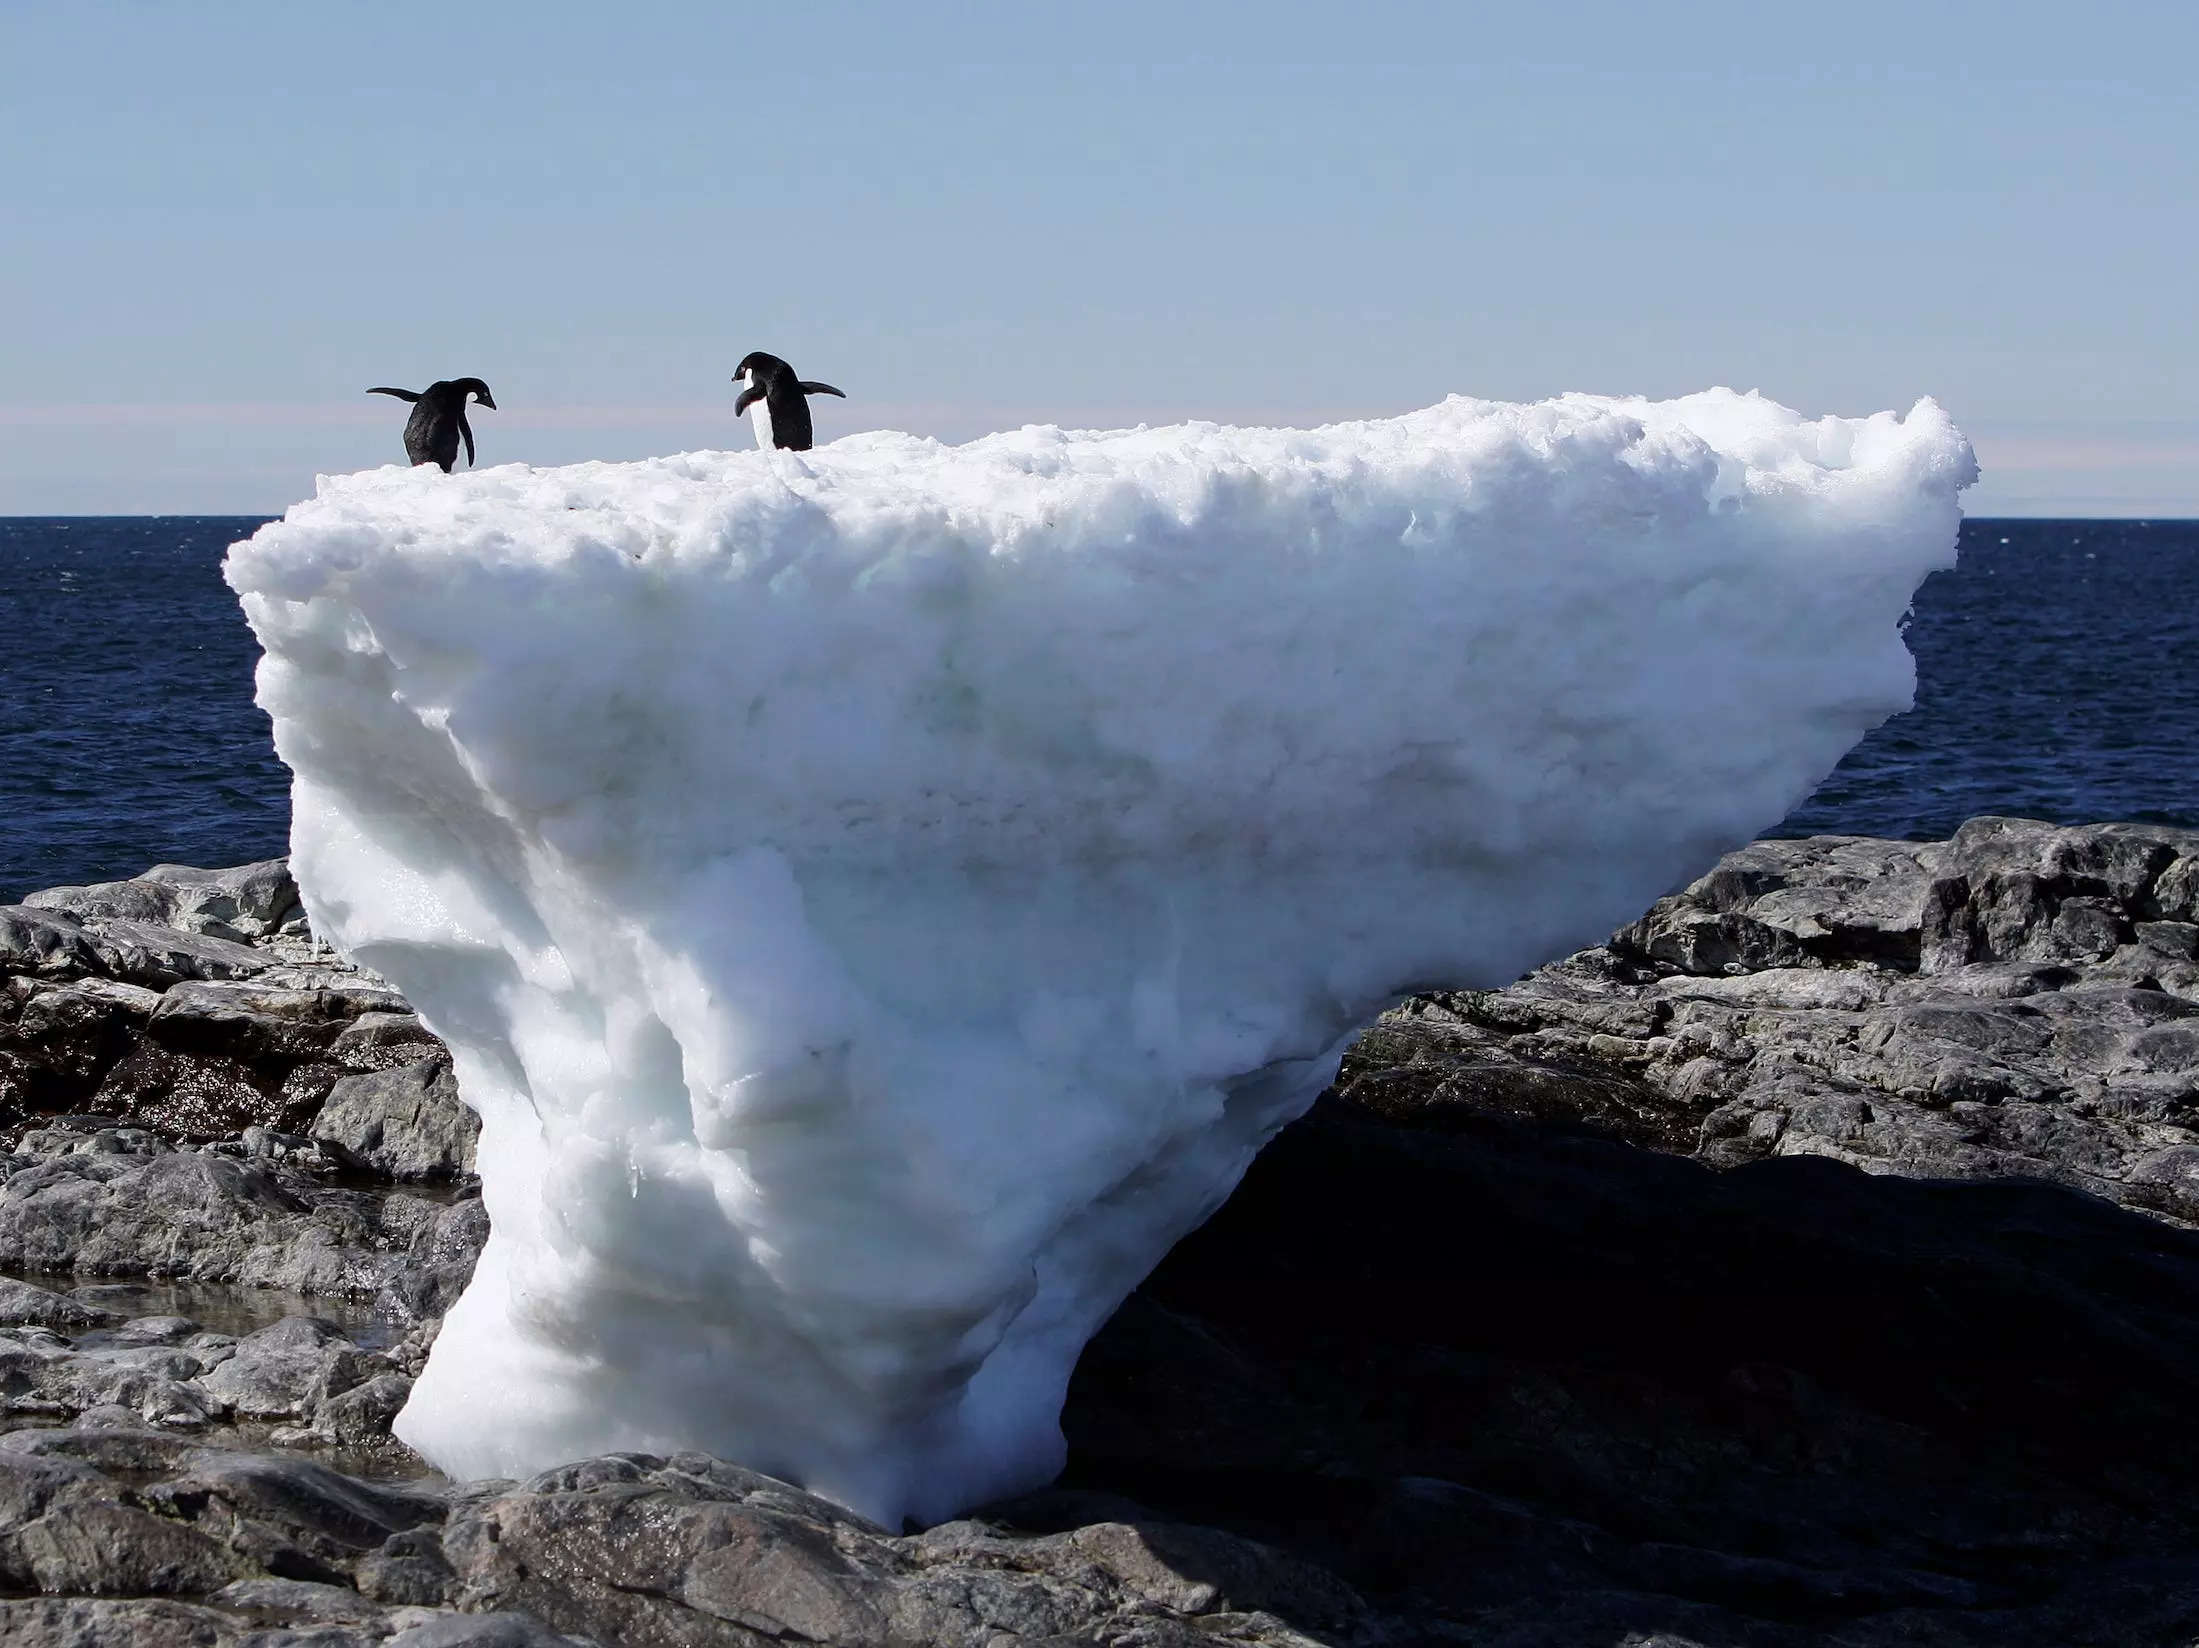
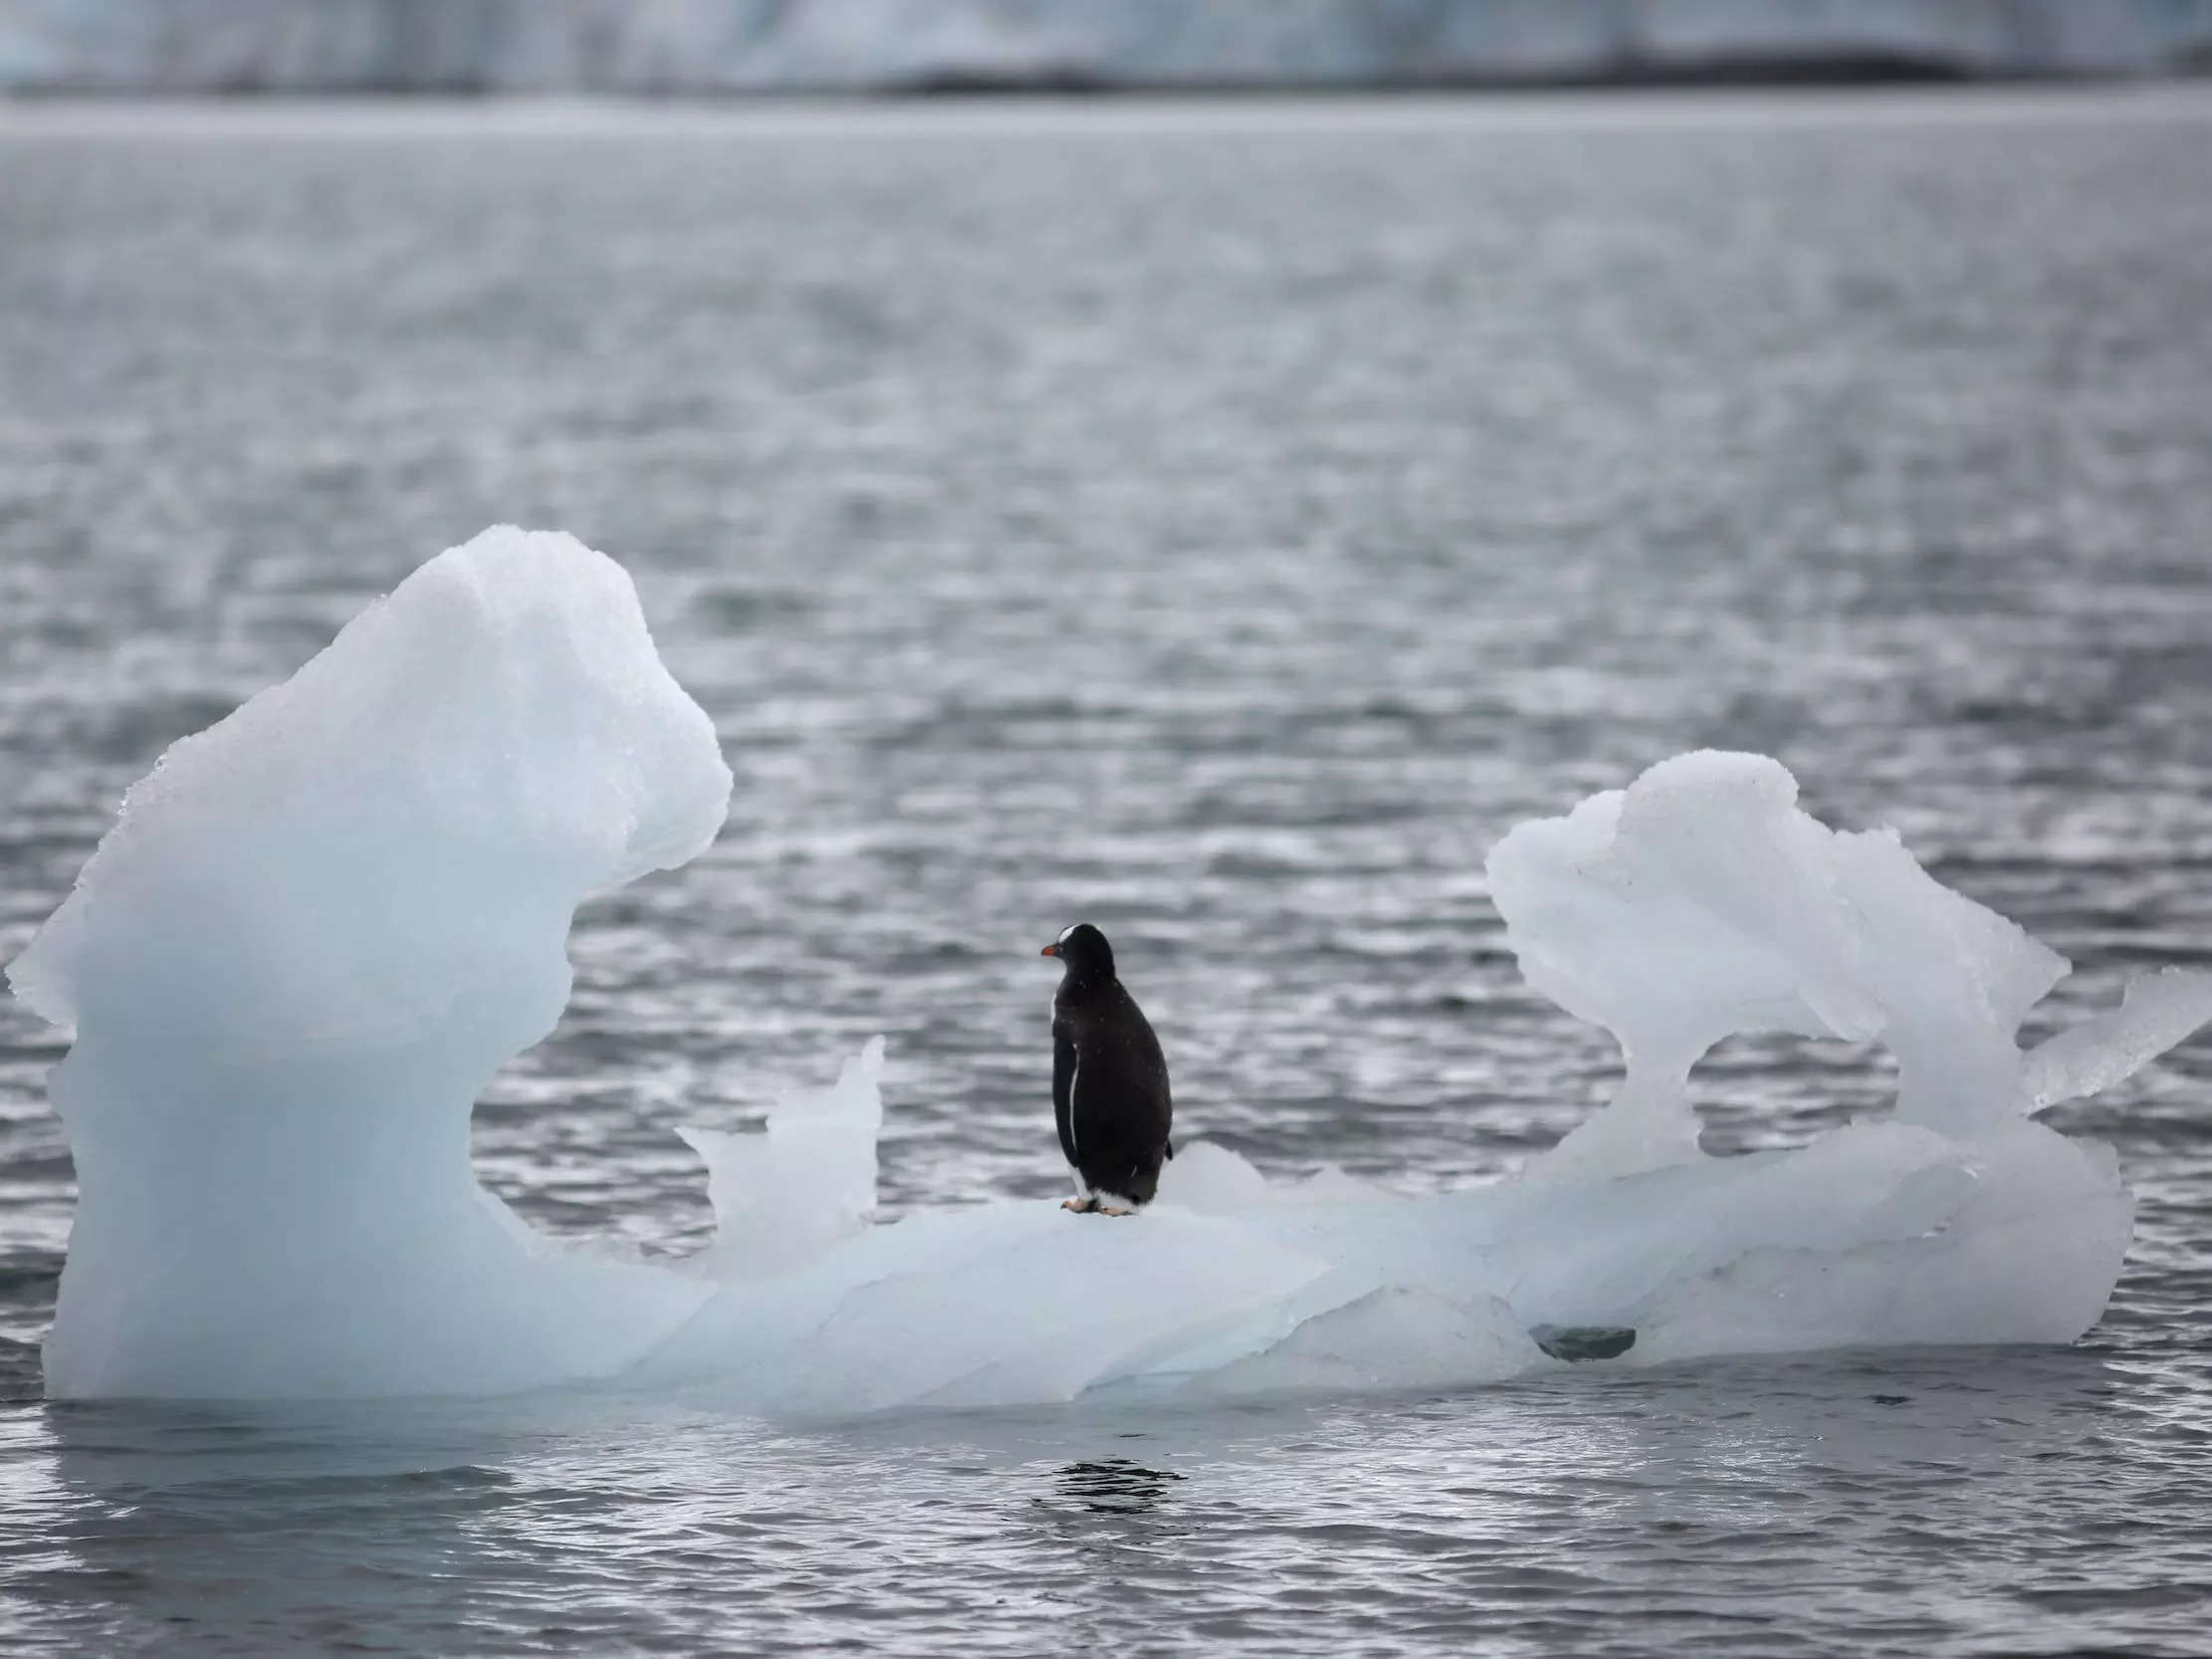
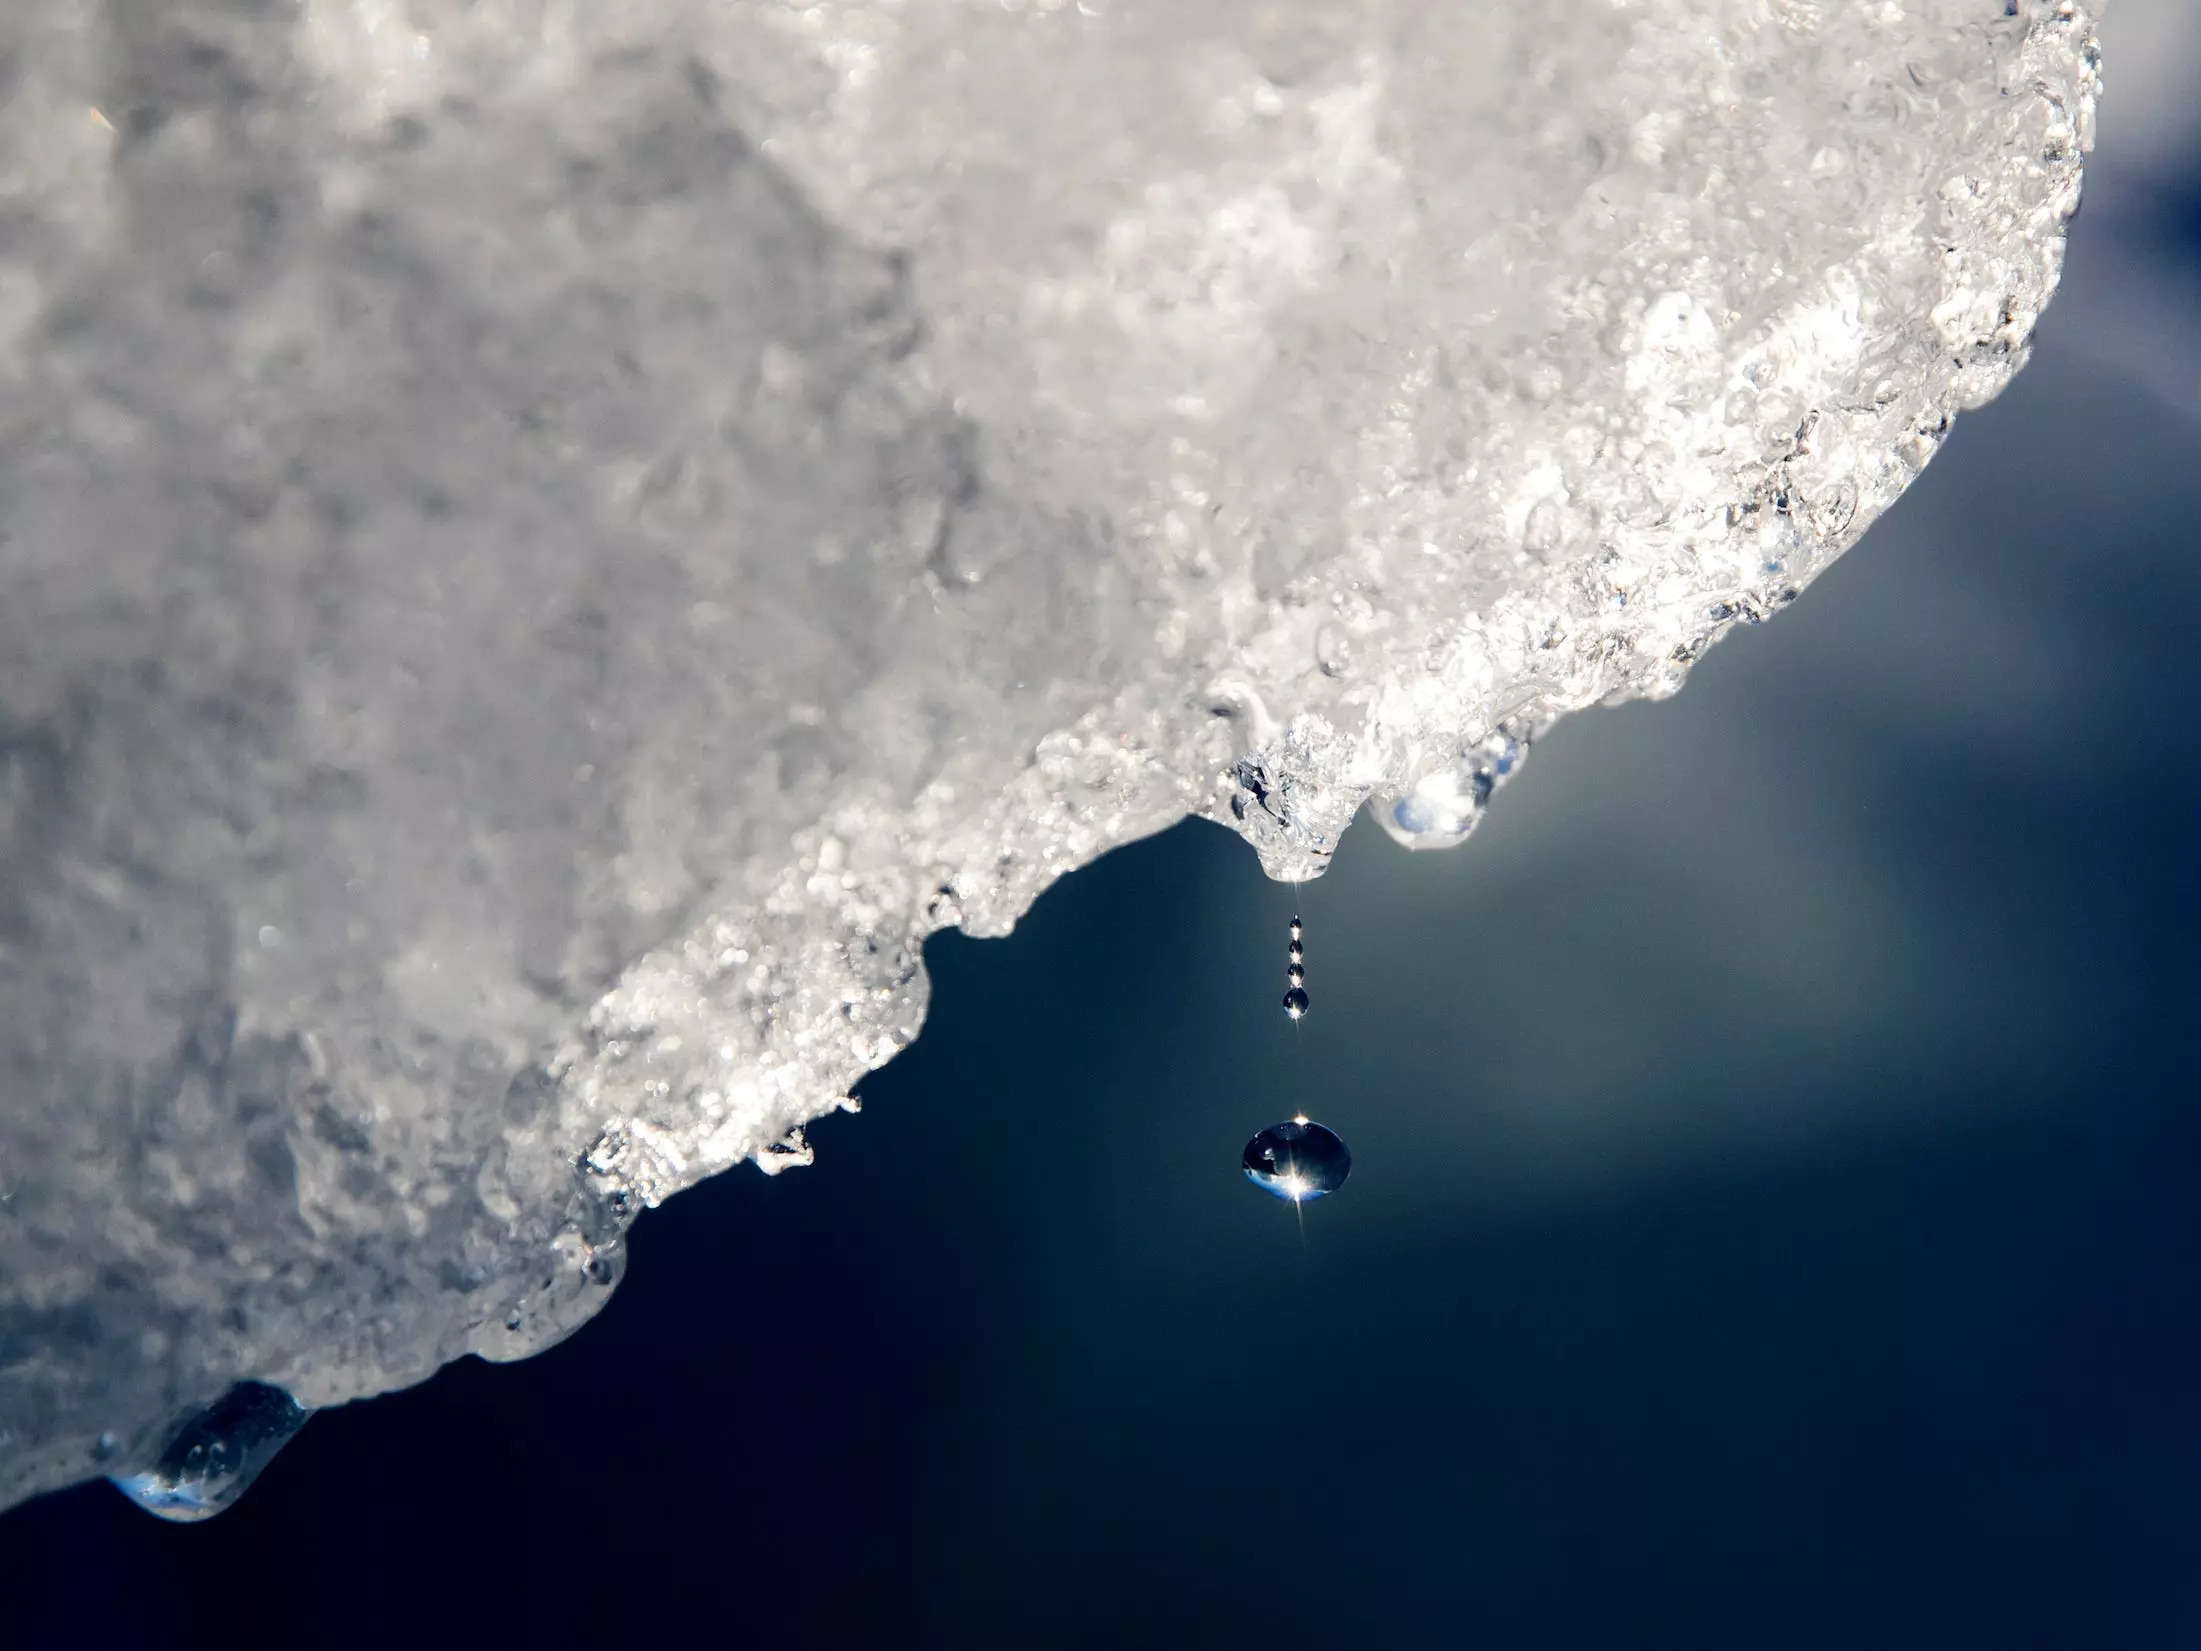

 excellent Images for Academic Interest ⬇⬆


 ------------------------------------------------------------------------------------------------------------------------


 A new record was set yesterday (based on data back to 2003) of the most snow cover across the continental U.S. Image: NWS


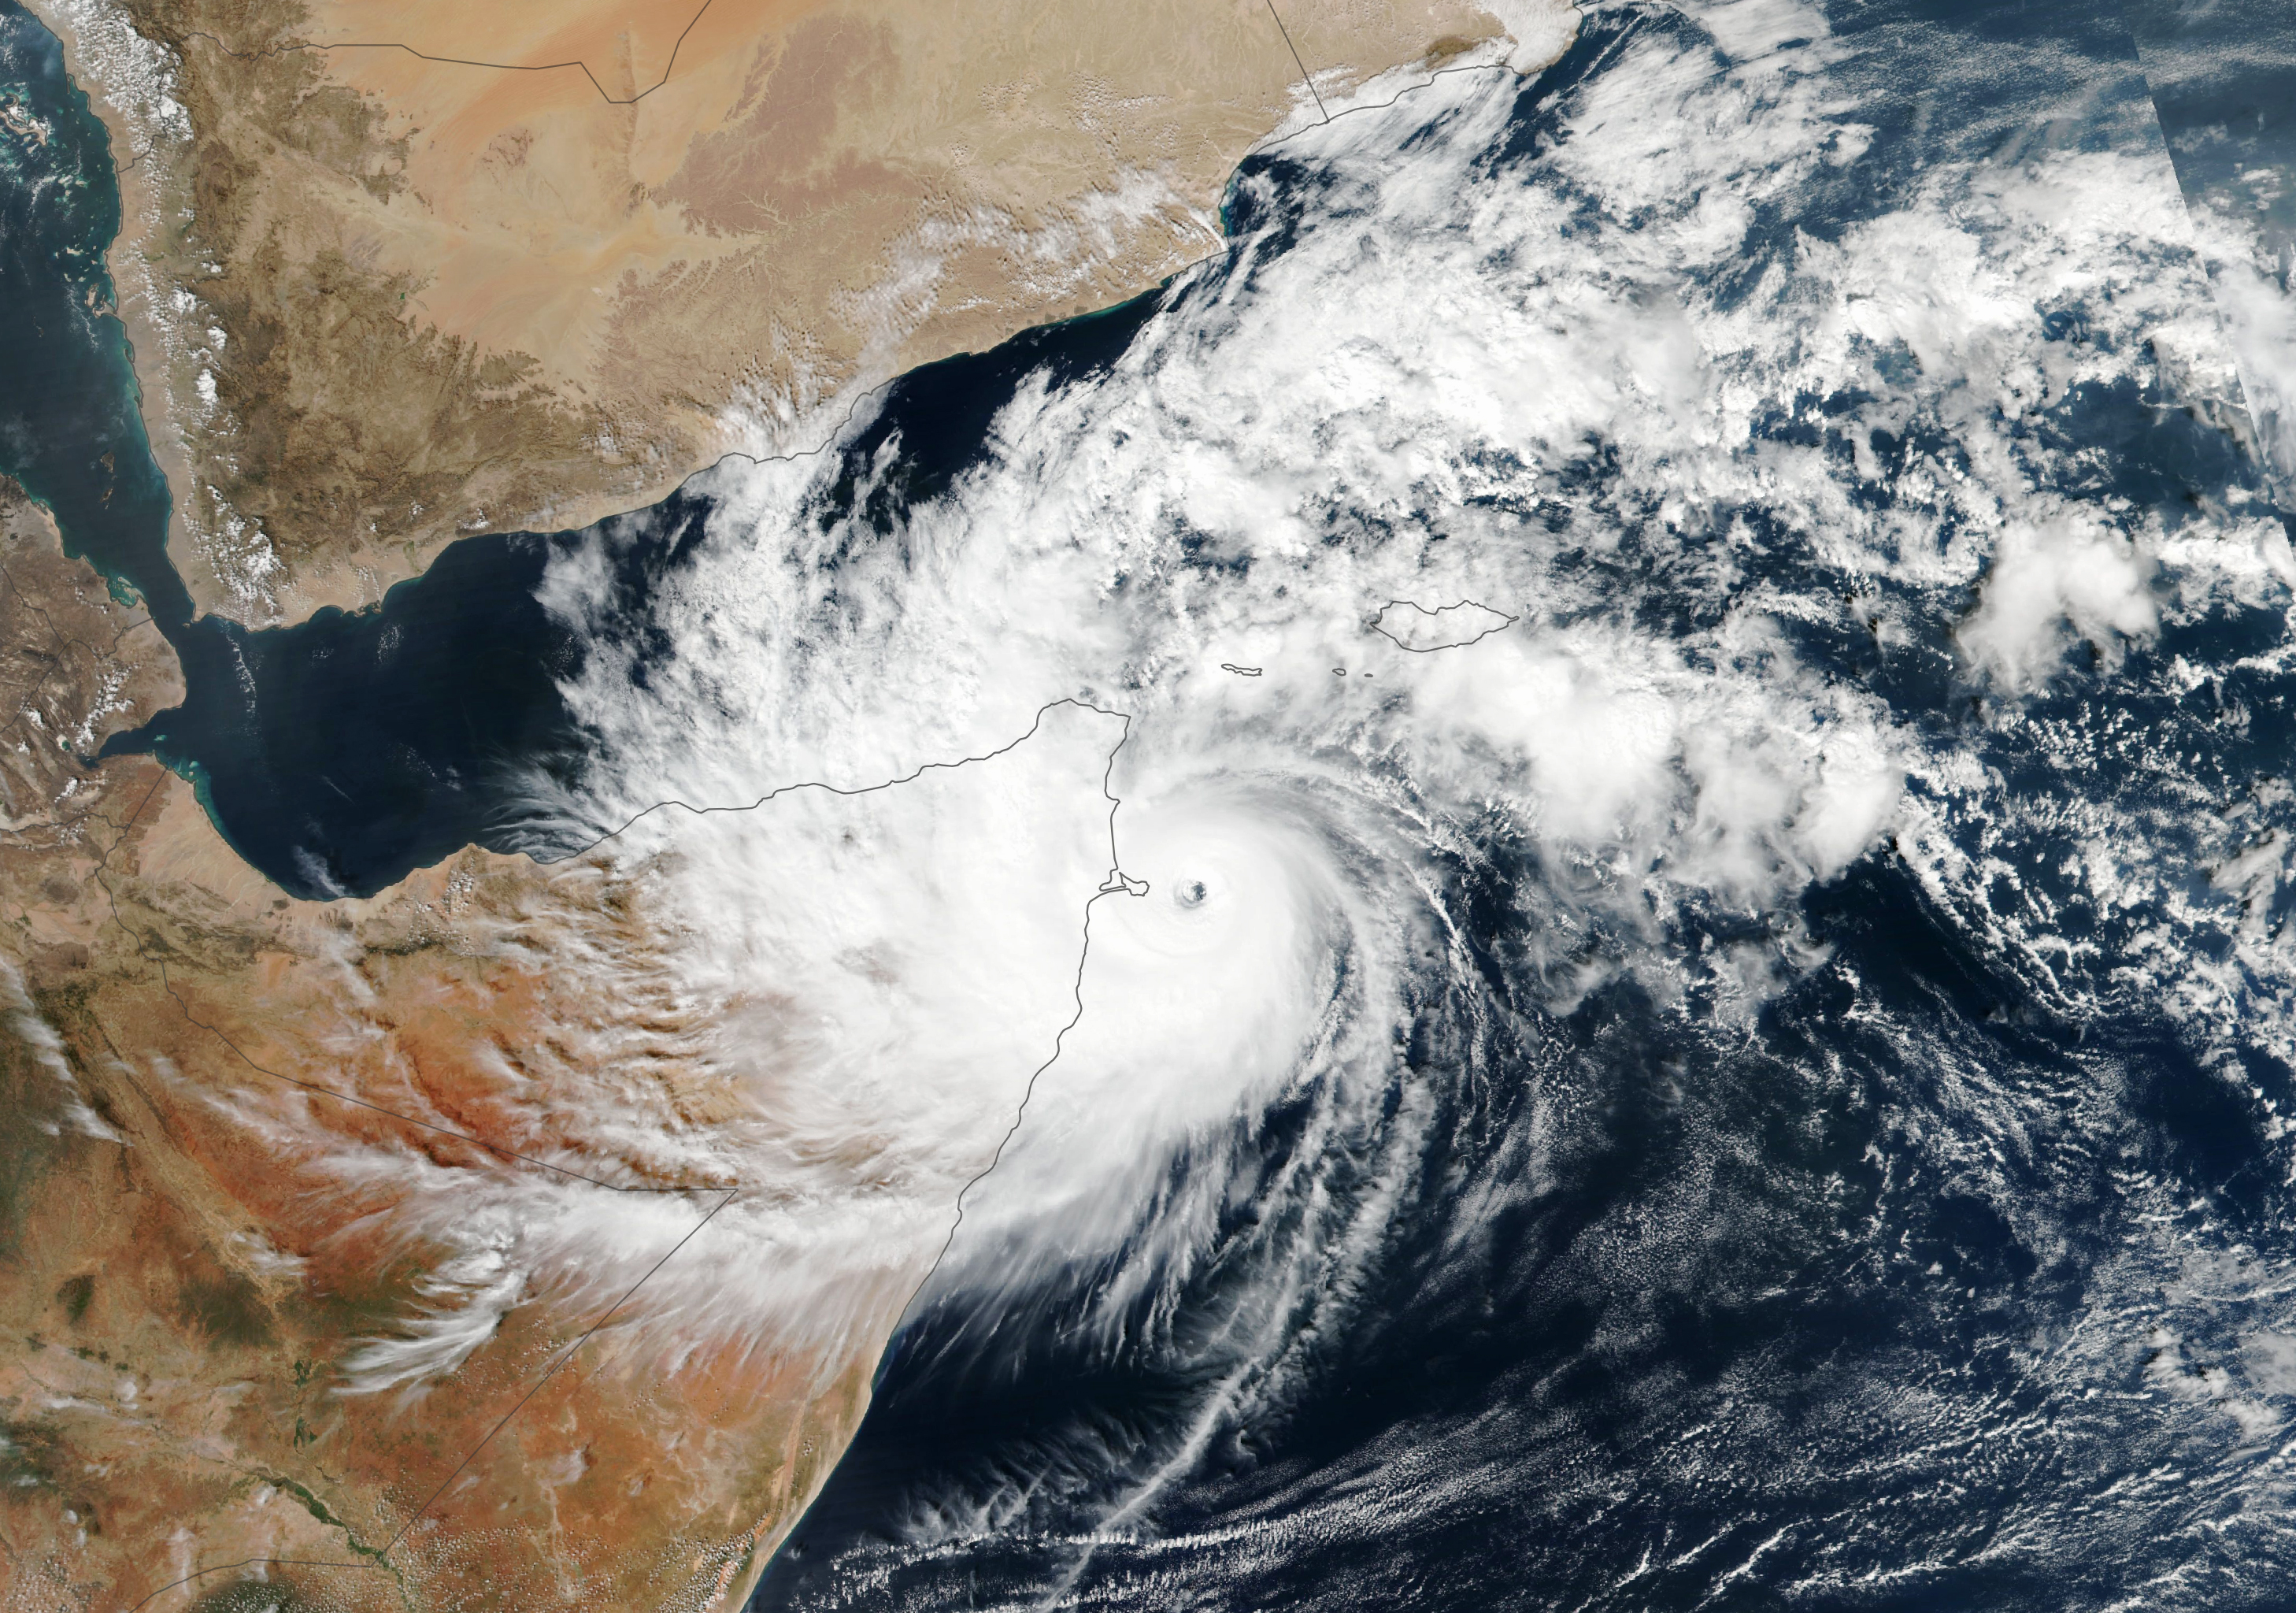


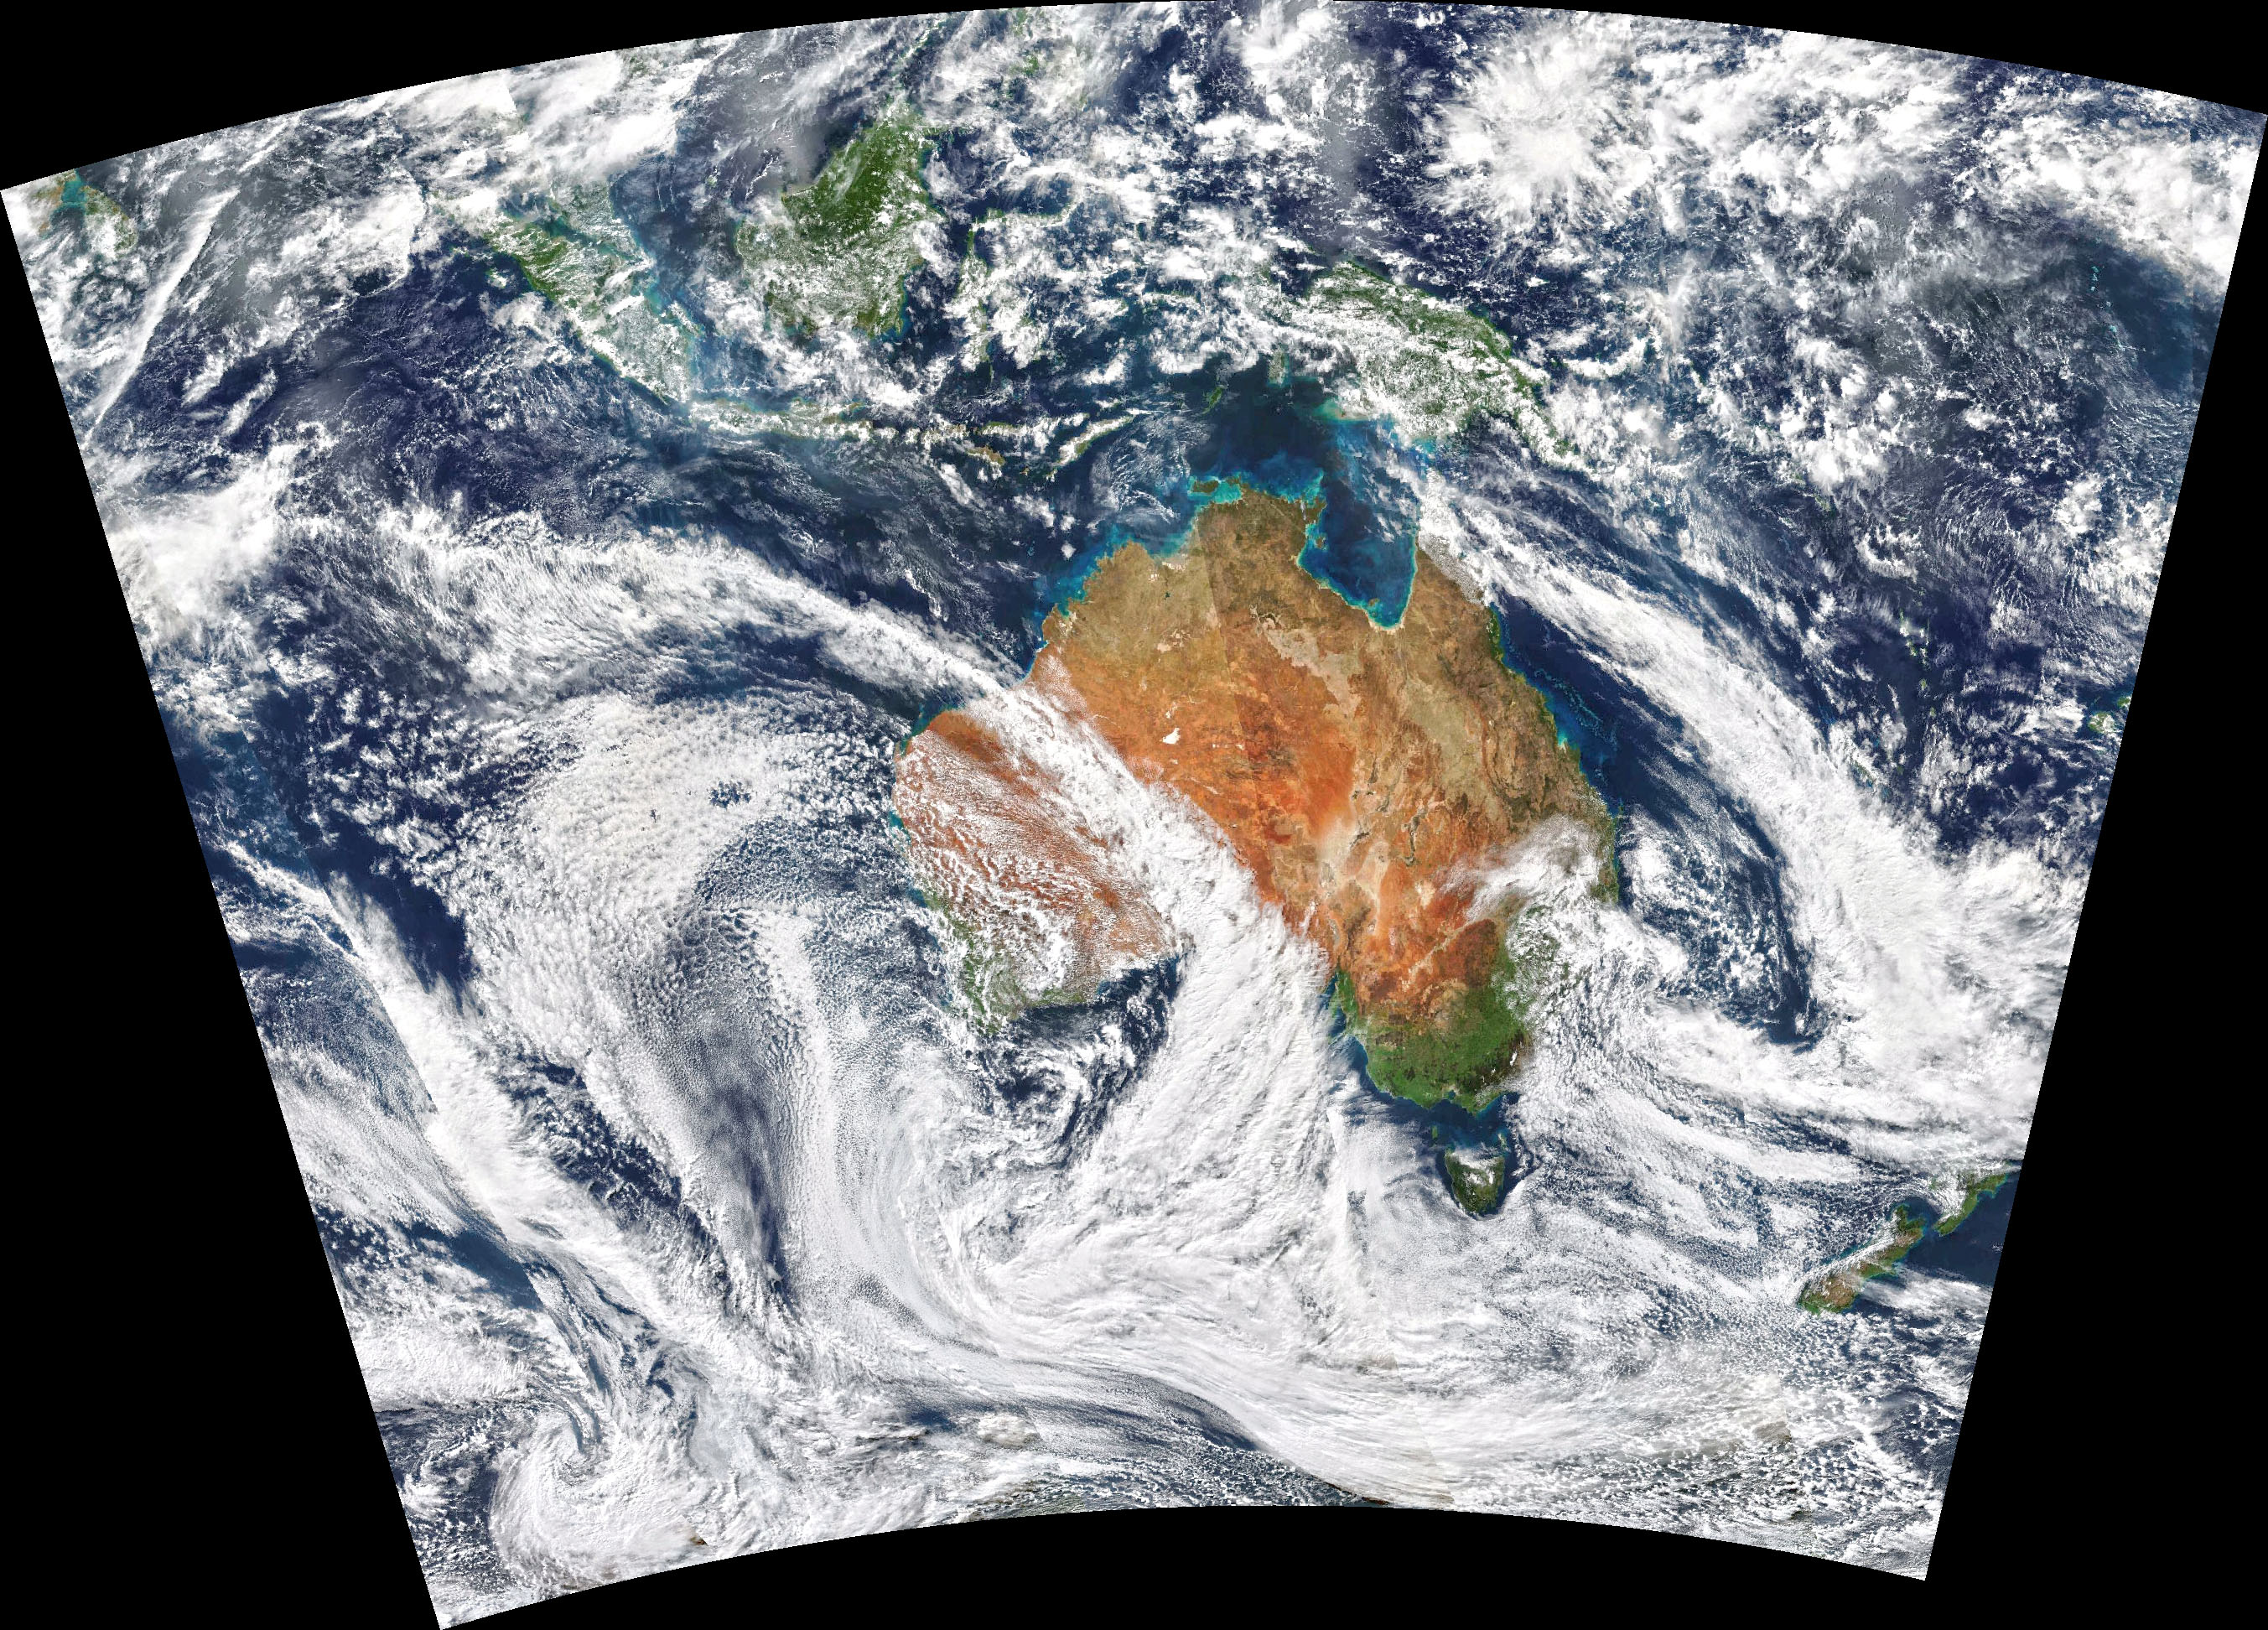


 June 29th


 Another way to appreciate our cool March would be to look at a map of the difference of this year's March temperature from normal (see below). Western Washington was much cooler than normal, with some areas 4-5F cooler than typical values. More normal temperatures east of the Cascade crest.
 Finally, I wanted to show you an extraordinary picture taken yesterday (Wednesday) around 5:20 PM from the Seattle SpaceNeedle PanoCam. With cold air aloft and great instability, there was a magnificent line of cumulus clouds along the western slopes of the Cascades. Just stunning.
 ------------------------------------------------------------------------------------------------------------------------------------------------------------------------------------------------------------------------------------------


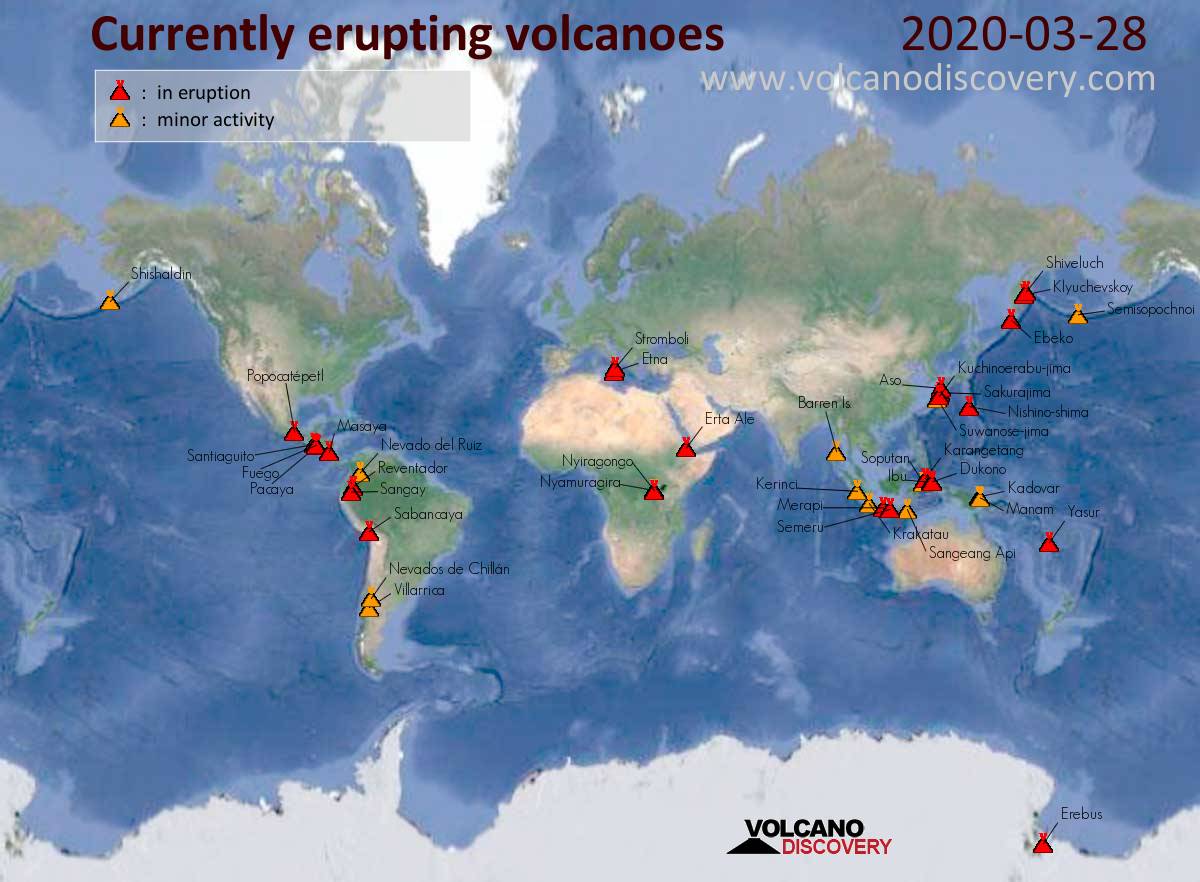


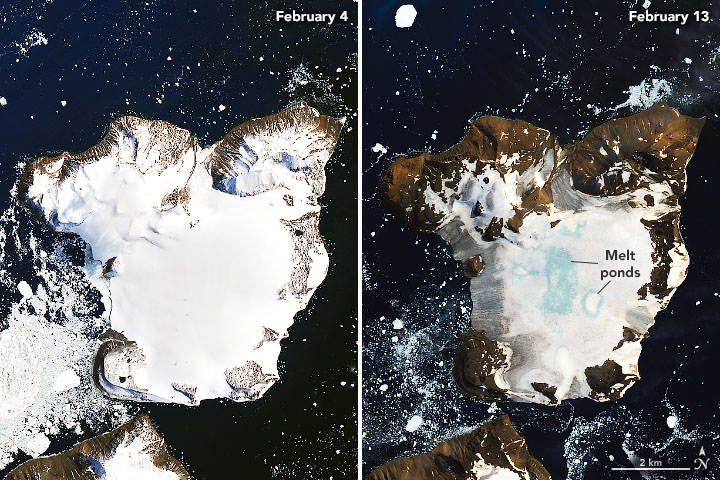
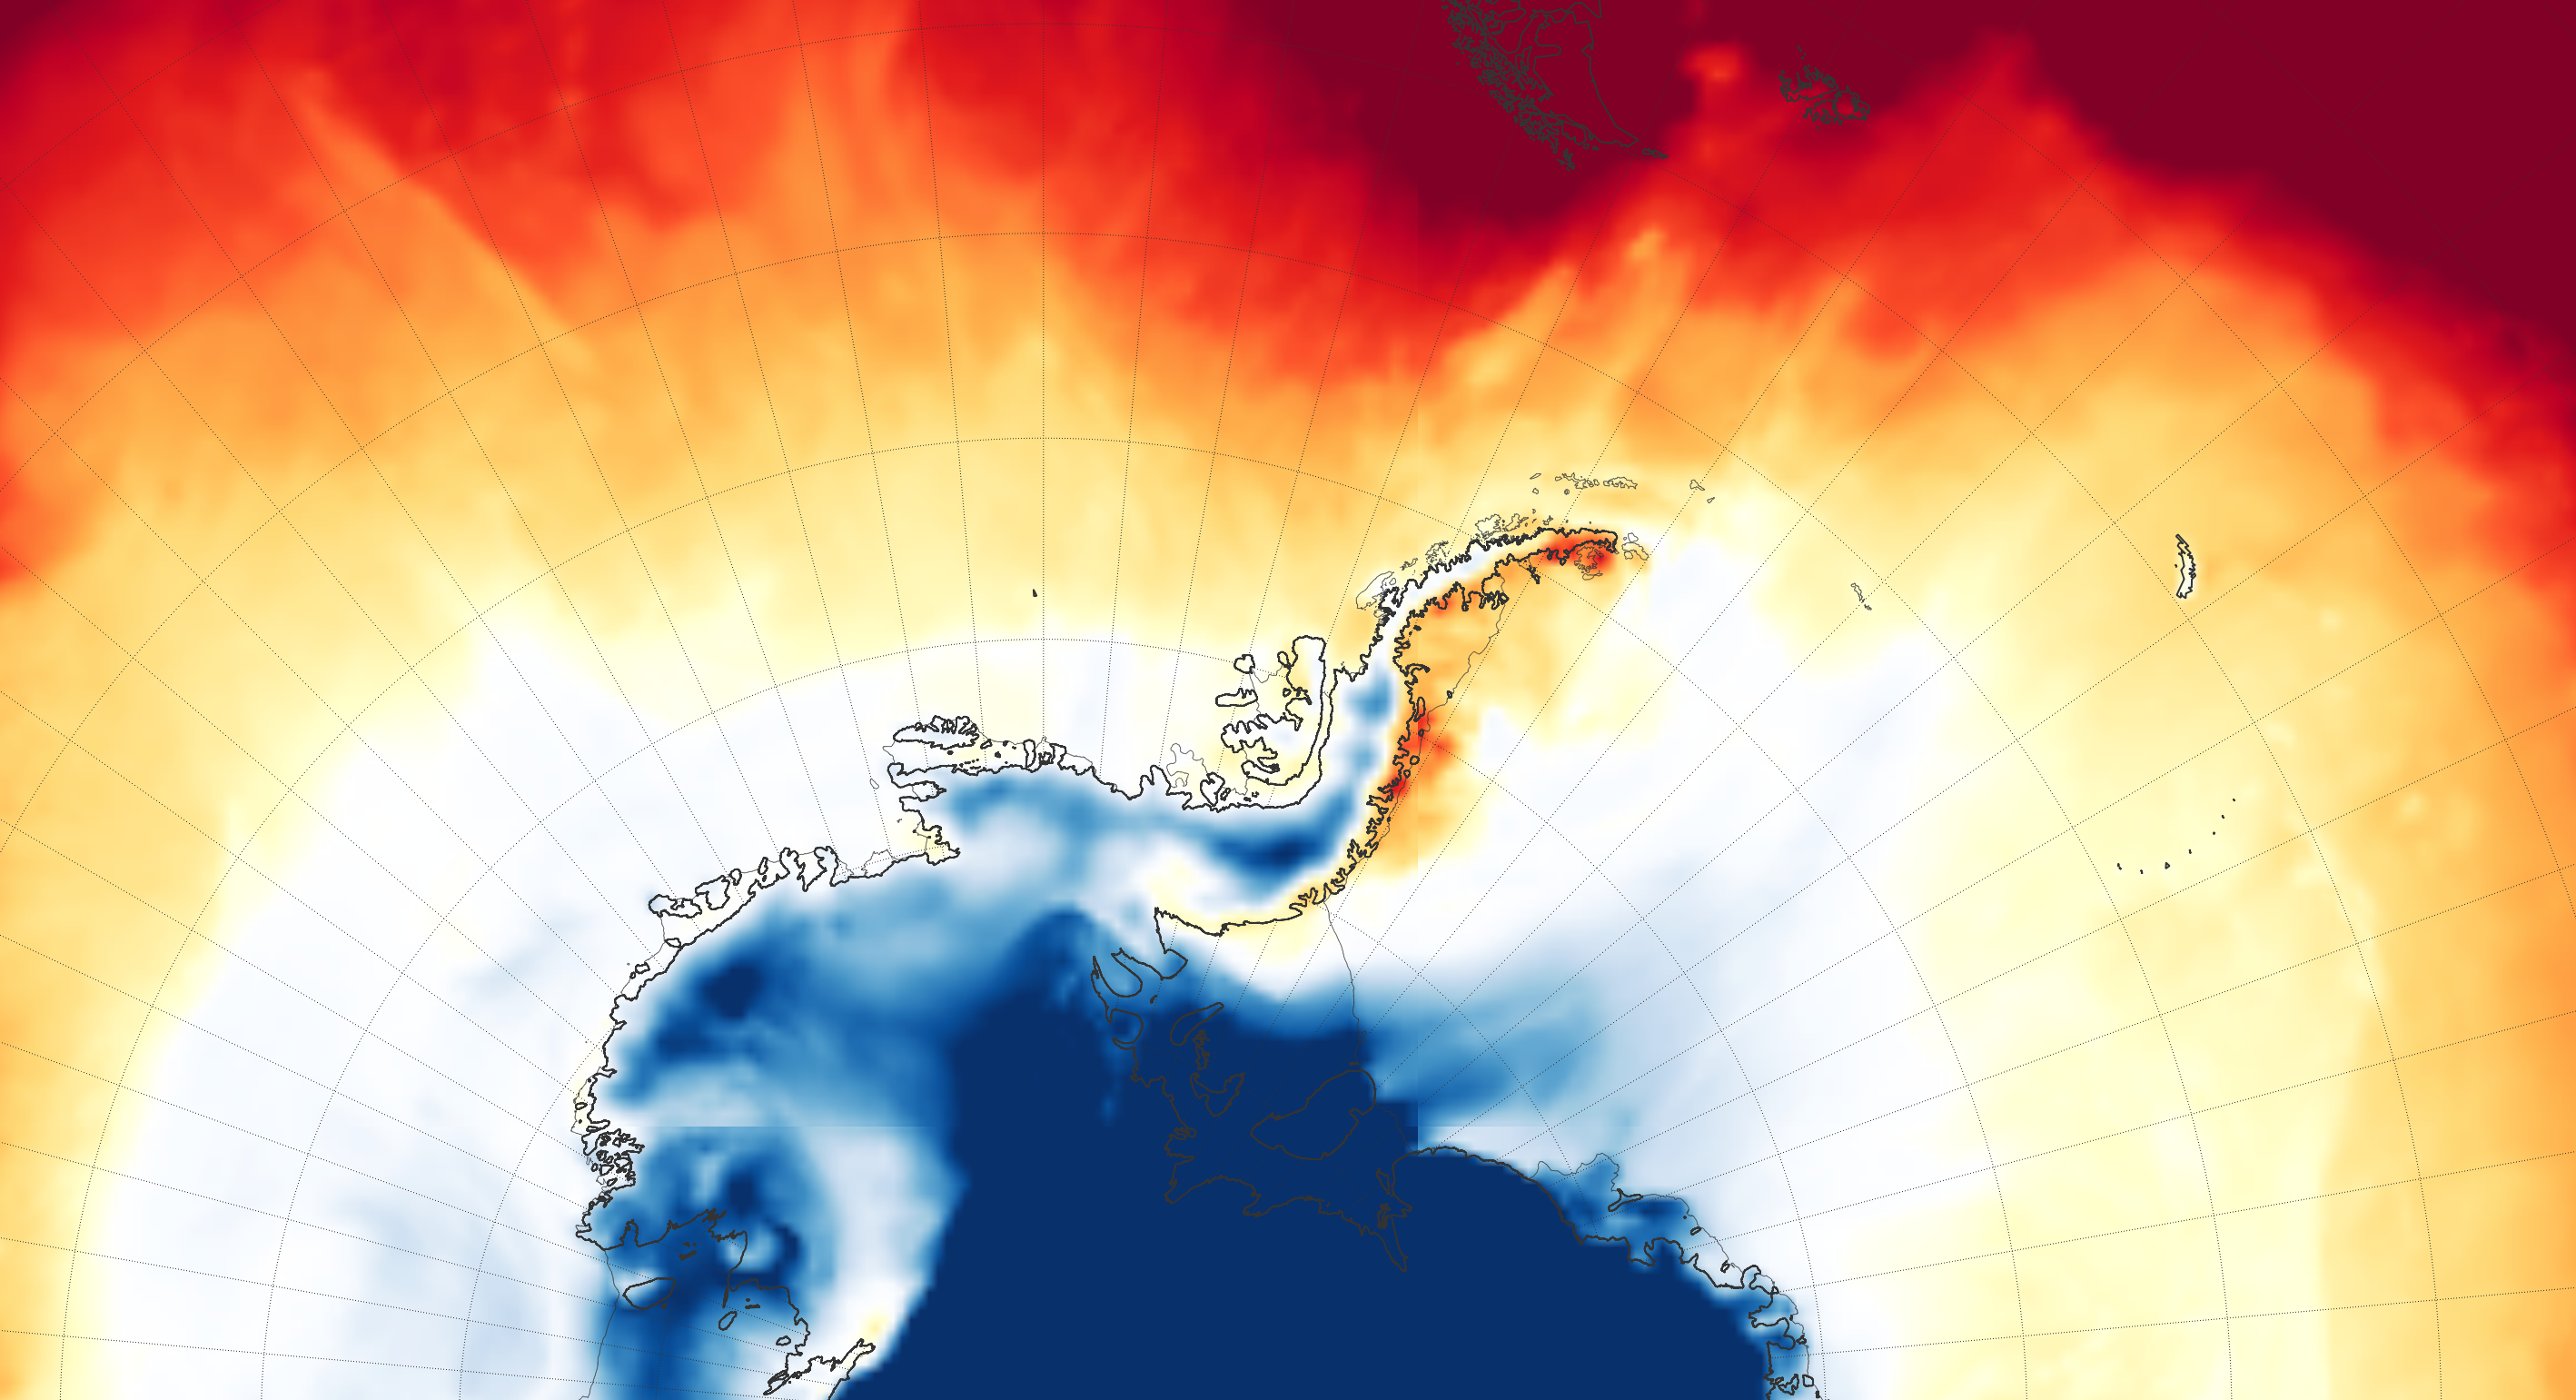


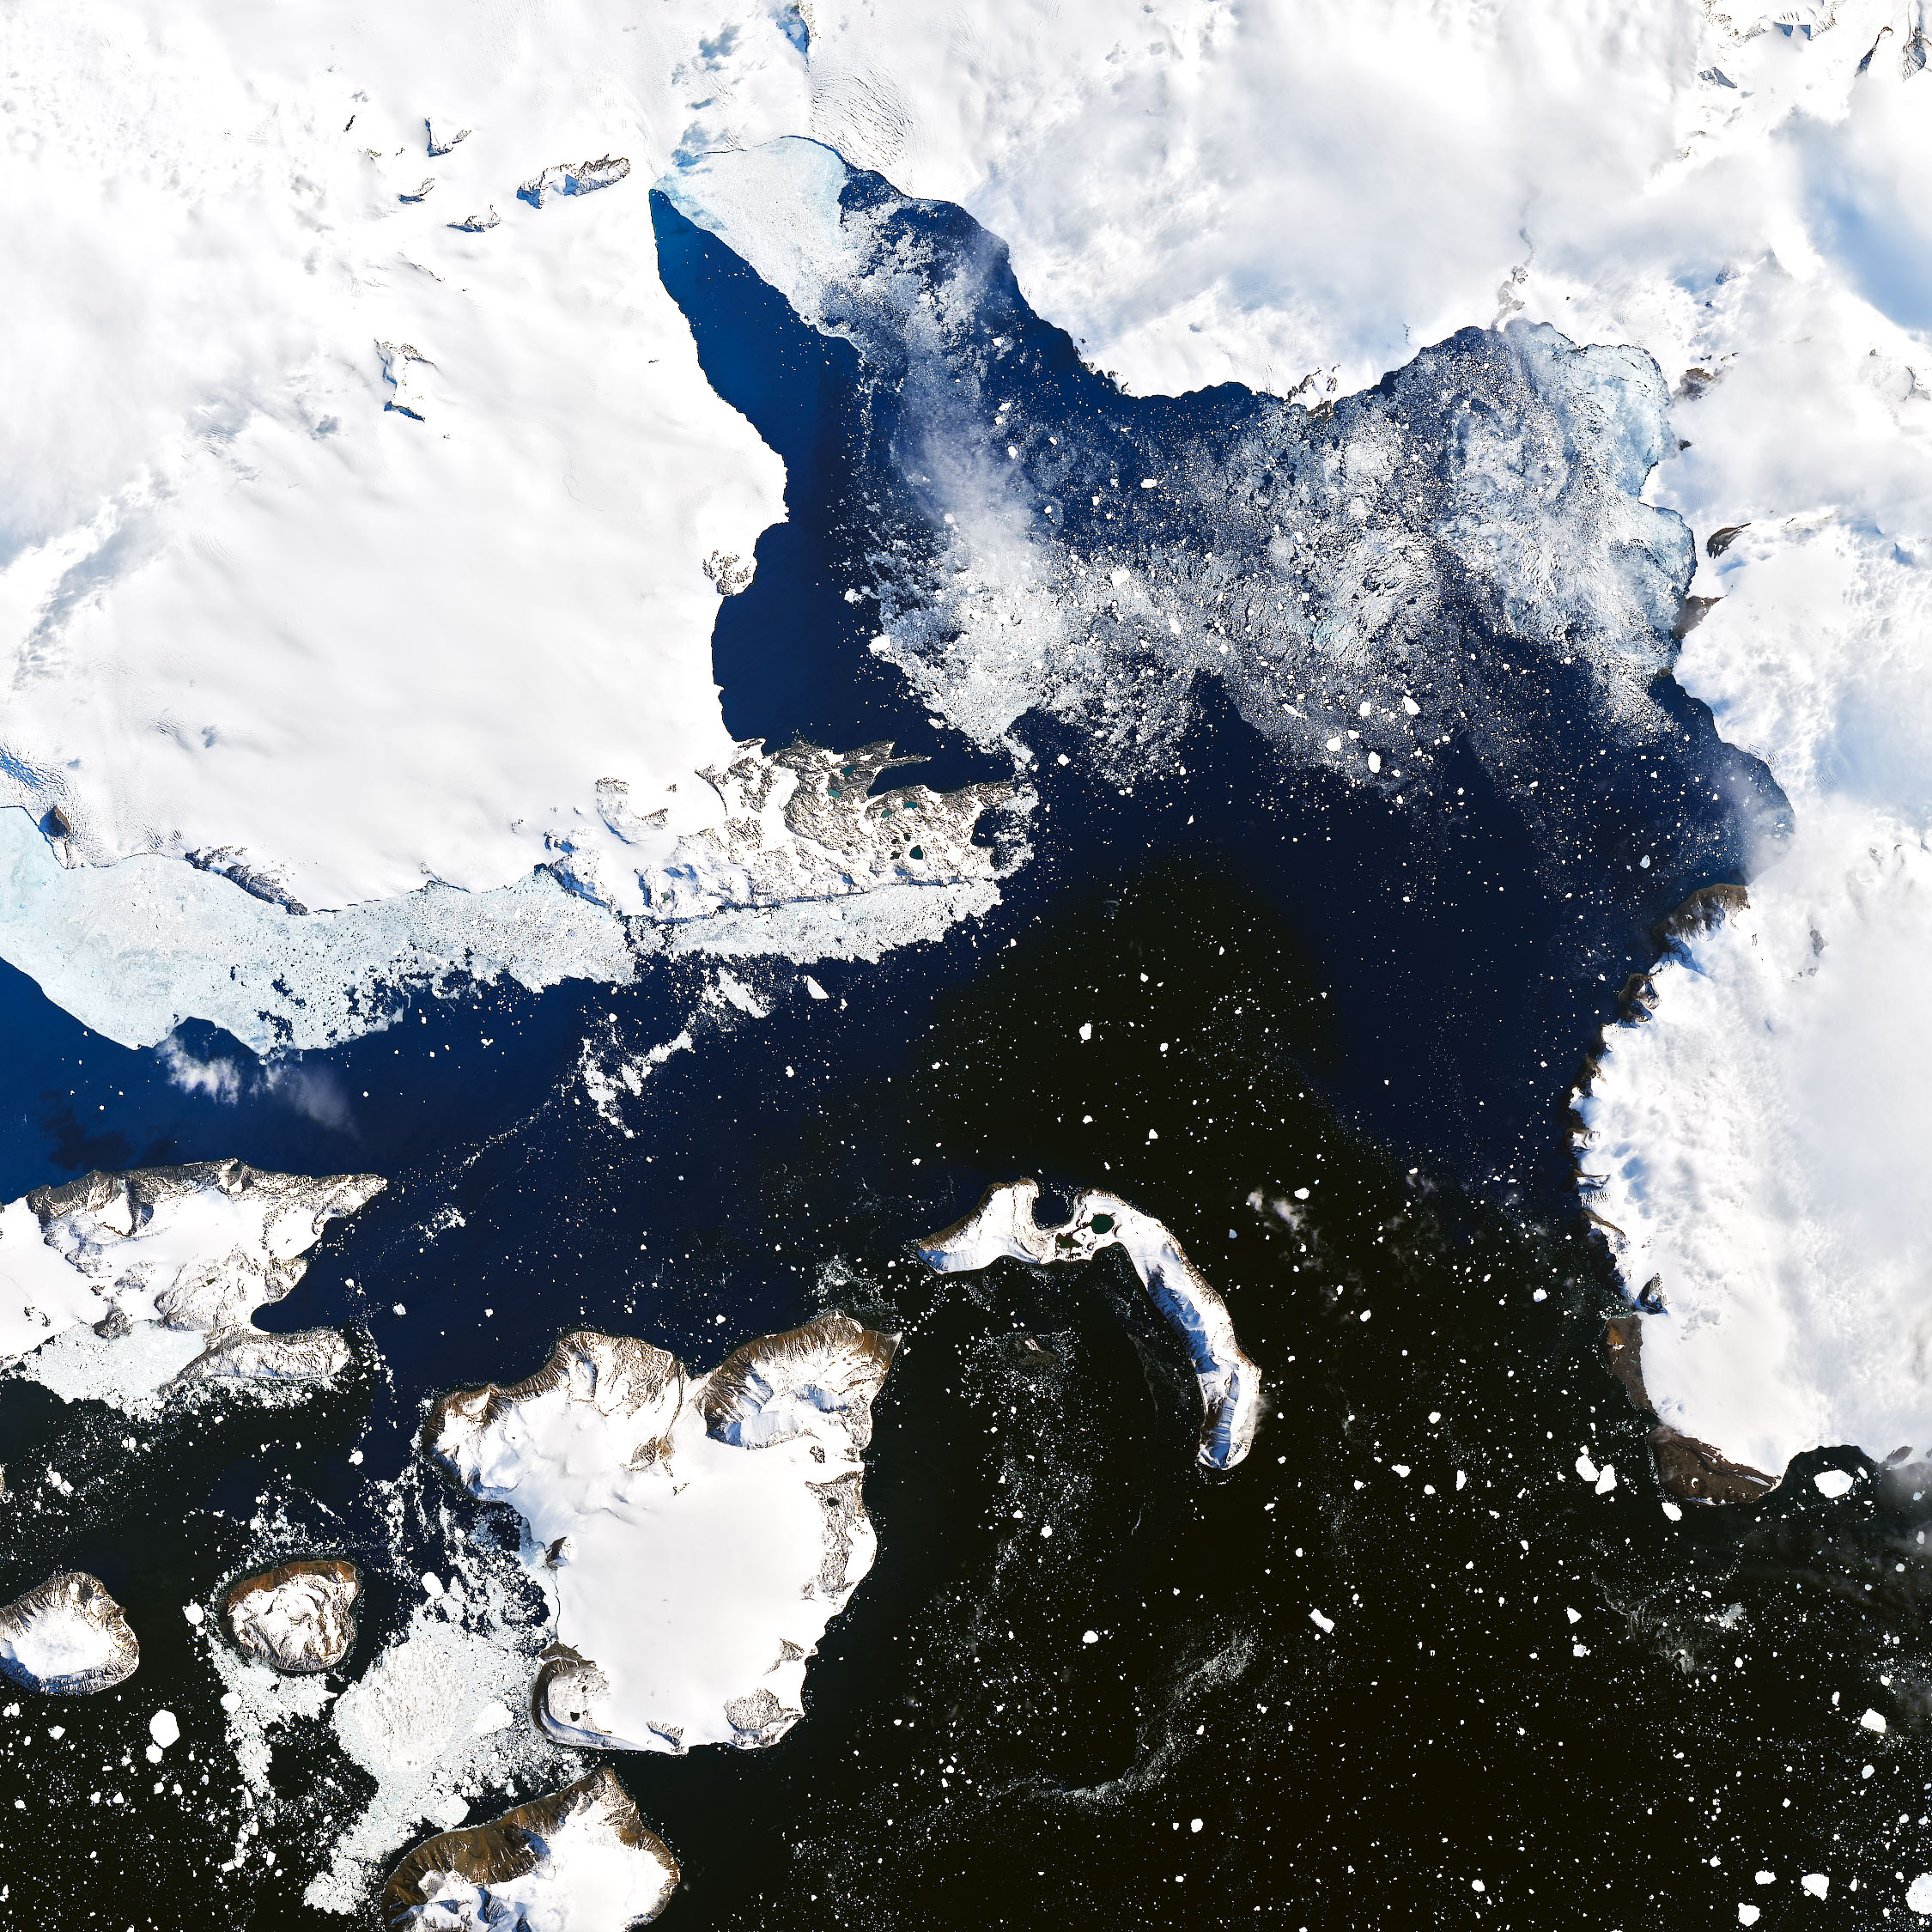
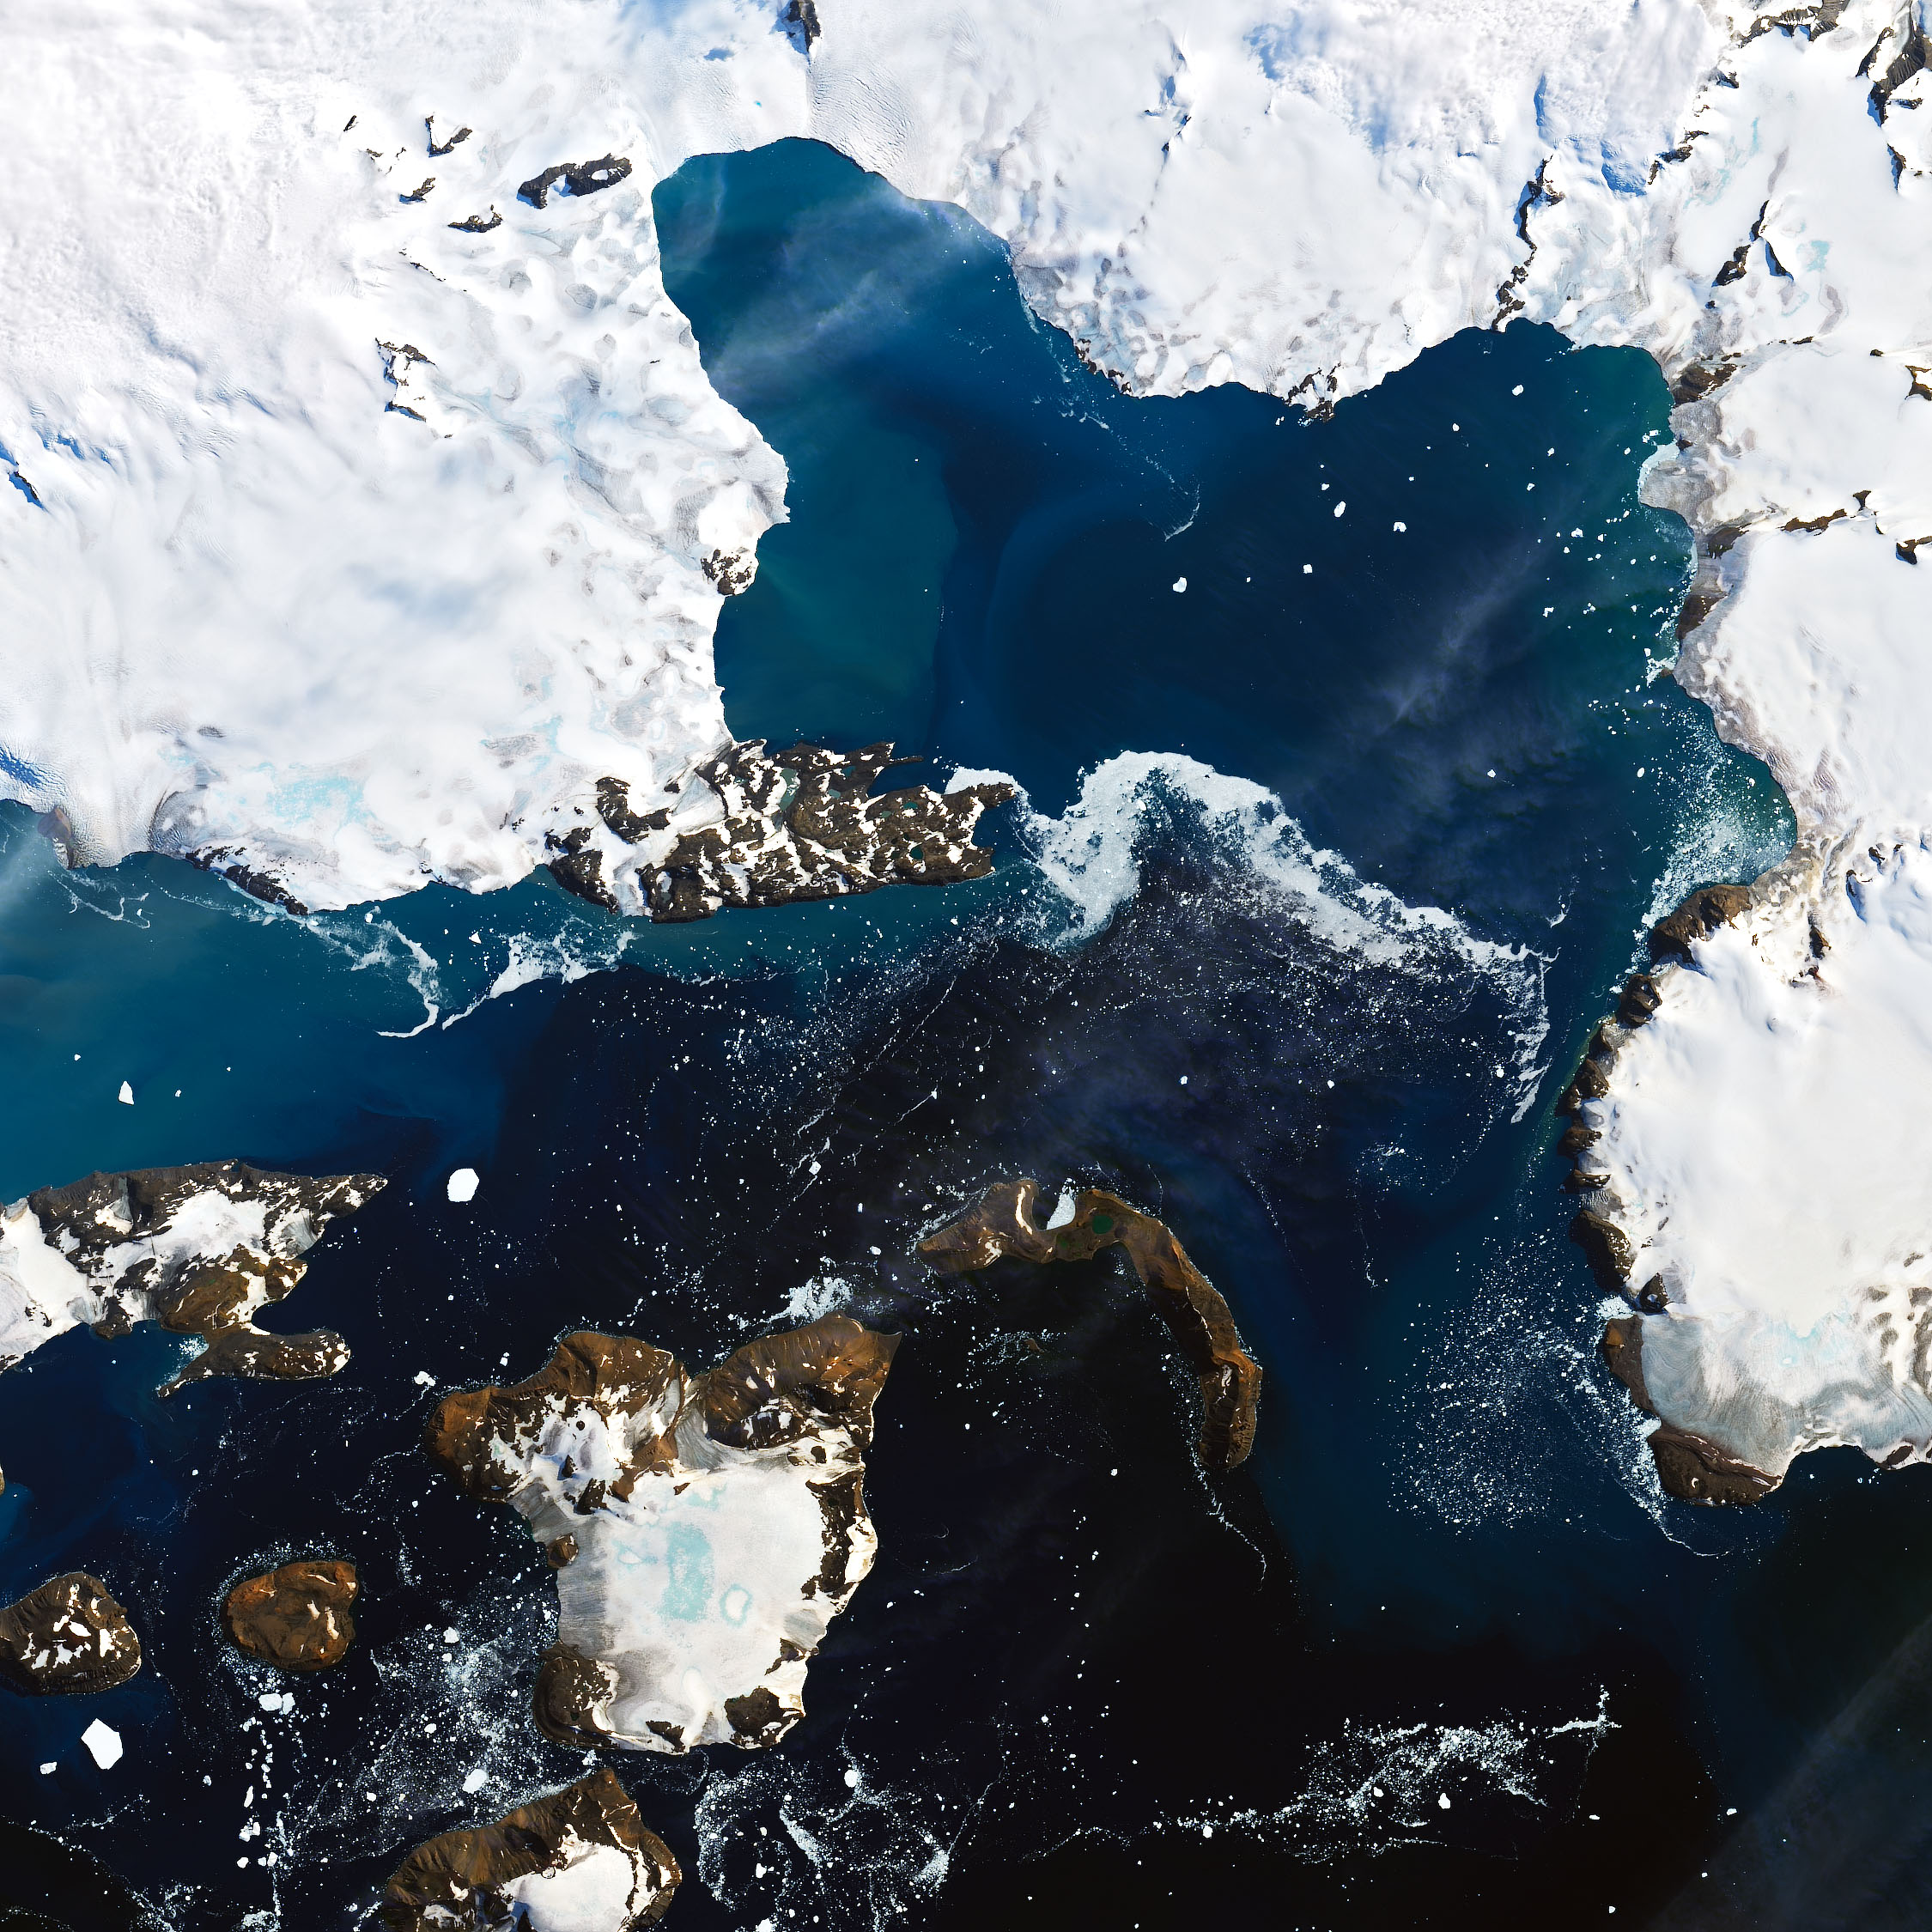
1 comment:
Thanks For sharing this Superb article.I use this Article to show my assignment in college.it is useful For me Great Work. https://weatherstationprofy.com/why-is-it-important-to-prepare-for-inclement-weather/
Post a Comment