Co Authors: GSB, Shreyas Dhavale, Pradeep John, Dr. Vineet Singh, Gokul
Weather Knowledge 1 ( 1 -34)
Weather Knowledge - 34
Total Precipitable Water ( TPW)
The animation above shows a model of the movement of total precipitable water vapor over the eastern Pacific Ocean from October 10-25, 2021. Green areas represent the highest amounts of moisture. Note the fingers of white to light green that repeatedly flow into the Pacific Northwest of North America. Note also how areas in the tropics are often saturated with moisture that can eventually curl up into middle latitudes.
Total precipitable water vapor is a measurement of the amount of water in a column of the atmosphere if all the water vapor in that column were condensed into liquid. The animation was derived from a NASA product known as the Goddard Earth Observing System Data Assimilation System (GEOS DAS), which uses satellite data and mathematical representations of physical processes to calculate what is happening in the atmosphere. Not all precipitable water vapor actually falls as rain. However, it is a useful indicator of regions where rainfall could be excessive.
(Earth Observatory NASA)
Weather Knowledge - 33
Posted 27th October...
As green chlorophyll fades from trees and plants each autumn, other pigments color the Earth's landscapes. Satellites take leaf-peeping to a whole new level... Images of Various satellite of last few years. (Academic Interest)
Weather Knowledge -32
Jet Streams Importance: (See also Weather Knowledge -17)
Jet stream theory
Jet streams of Earth
This theory tries to explain the establishment of the northeast and southwest monsoons, as well as unique features like "bursting" and variability.
The jet streams are systems of upper-air westerlies. They give rise to slowly moving upper-air waves, with 250-knot winds in some air streams. First observed by World War II pilots, they develop just below the tropopause over areas of steep pressure gradient on the surface. The main types are the polar jets, the subtropical westerly jets, and the less common tropical easterly jets. They follow the principle of geostrophic winds.
Process of monsoon creation
Over India, a subtropical westerly jet develops in the winter season and is replaced by the tropical easterly jet in the summer season. The high temperature during the summer over the Tibetan Plateau, as well as over Central Asia in general, is believed to be the critical factor leading to the formation of the tropical easterly jet over India.
The mechanism affecting the monsoon is that the westerly jet causes high pressure over northern parts of the subcontinent during the winter. This results in the north-to-south flow of the winds in the form of the northeast monsoon. With the northward shift of the vertical sun, this jet shifts north, too. The intense heat over the Tibetan Plateau, coupled with associated terrain features like the high altitude of the plateau, generate the tropical easterly jet over central India. This jet creates a low-pressure zone over the northern Indian plains, influencing the wind flow toward these plains and assisting the development of the southwest monsoon
Jet stream theory
According to this theory, the onset of the southwest monsoon is driven by the shift of the subtropical westerly jet north from over the plains of India toward the Tibetan Plateau. This shift is due to the intense heating of the plateau during the summer months. The northward shift is not a slow and gradual process, as expected for most changes in weather pattern. The primary cause is believed to be the height of the Himalayas. As the Tibetan Plateau heats up, the low pressure created over it pulls the westerly jet north. Because of the lofty Himalayas, the westerly jet's movement is inhibited. But with continuous dropping pressure, sufficient force is created for the movement of the westerly jet across the Himalayas after a significant period. As such, the shift of the jet is sudden and abrupt, causing the bursting of southwest monsoon rains onto the Indian plains. The reverse shift happens for the northeast monsoon.
The jet stream effect
The jet stream theory also explains the variability in timing and strength of the monsoon.
Timing: A timely northward shift of the subtropical westerly jet at the beginning of summer is critical to the onset of the southwest monsoon over India. If the shift is delayed, so is the southwest monsoon. An early shift results in an early monsoon. Strength: The strength of the southwest monsoon is determined by the strength of the easterly tropical jet over central India. A strong easterly tropical jet results in a strong southwest monsoon over central India, and a weak jet results in a weak monsoon.
{Rain variability ("vagaries")
One of the most commonly used words to describe the erratic nature of the monsoon is "vagaries", used in newspapers, magazines, books, web portals to insurance plans, and India's budget discussions. In some years, it rains too much, causing floods in parts of India; in others, it rains too little or not at all, causing droughts. In some years, the rain quantity is sufficient but its timing arbitrary. Sometimes, despite average annual rainfall, the daily distribution or geographic distribution of the rain is substantially skewed. In the recent past, rainfall variability in short time periods (about a week) were attributed to desert dust over the Arabian Sea and Western Asia.}
Weather Knowledge -31
Rainfoot & Microburst in same frame
Weather Knowledge - 30
Sprites...Jellyfish sprites.
Paul Smith just photographed a magnificent display over Kansas on 6th April 2021..
Sprites are a weird form of lightning that leap up from powerful thunderstorms. These are "jellyfish sprites", named for their resemblance to sea creatures. Their red tentacles stretch about 90 km high, almost touching the edge of space.
At this time of year, severe storms set the stage for sprite formation. Mesoscale convective systems sweep across the Great Plains, cracking with intense electric fields that drive electrons up and into sprites. La Niña conditions in the Pacific Ocean may amplify this process.
"I was about 200 miles away from the thunderstorm," says Smith. Turns out, that's about the right distance. You have to be far away to see sprites over the top of the thunderclouds.
Courtesy Spaceweather.com
Weather Knowledge - 29
Simple Identification of clouds.
What are the Secrets to Identifying Clouds? People are particularly interested in learning how to identify clouds and to understand what they imply about upcoming weather. What is meant by the arcane compound names, such asaltostratus,cirrostratus, or the intriguingaltocumulus lenticularis?
Their essential approach was to divide clouds into four types depending on how they look and three classifications based on their heights. First, the four types based on appearance:
Stratus or strato-form layered or sheet-like clouds
Cirrus or cirro-form: thin, wispy clouds
Cumulus or cumulo-form: puffy cotton-ball like clouds that can sometimes have great vertical development
Nimbus: precipitating clouds
Here is an example of a stratus type cloud; you see how layered it is?
A cirrus type cloud is shown below.... delicate and wispy.
cumulus cloud has a characteristic cotton ball appearance, although some folks think they look like cauliflowers.
And then there are nimbus-type clouds, from which precipitation is falling:
Once we determine which of the four main cloud types is applicable, we then estimate the height of the clouds, dividing them into three main layers: low, medium and high.
Low: less than 2 kilometers above the surface, sometimes given the prefix strato
Middle: 2-7 km above the surface, often using the prefix "alto"
High: more than 7 km above the surface, often using the prefix "cirro"
Low clouds are usually made of water droplets, high clouds mainly ice crystals, and the middle clouds can be both.
OK, now you are ready to put it all together. Most cloud names combine a prefix and a suffix, the prefix denoting the height of the cloud and the suffix providing the cloud form.
For example, cirrostratus is a high ice cloud in a layer
Altocumulusis middle-level cloud that is divided into cumulus-type elements:
And cumulonimbus is a cumulus-type cloud that is precipitating:
Rare Upside Down Lightning Viewed over Puget Sound
On 27th Feb 2021 evening, camera 3 of Greg Johnson's wonderful Skunk Bay weather site captured an extraordinary lightning picture (see below), with the camera looking east over Whidbey Island from its location over the northern Kitsap Peninsula.
What is so amazing and unusual about this lightning?
Look how it starts at a single point at the surface and then fans out into multiple lightning channels as it rises. It looks like something out of the movie Ghostbusters or some science fiction flick!
Most lightning does not look that this.... in fact, 99% of lightning hitting the ground does just the opposite, dividing into multiple branches as it approaches the ground from above...(see below)
.The lightning that hit Whidbey Island around 8 PM on Friday represents "upward-moving" or "ground to cloud" lightning. Such lighting not only has a strong thunderstorm or cumulonimbus cloud above, but generally starts on some kind of high tower, itself often on a hill or higher terrain.
In the picture above (reproduced below) and with the help of Greg Johnson, we determined that the right-most upward lightning bolt came over off a big tower located at the red "plus" symbols. If you look closely, you can see a red light at the top of the tower. We are still working on determining the second tower location to its left.
Inside that strong band, there was intense charge separation in the clouds that led to an increasing potential difference between the surface and the clouds. The surface towers acting as foci for the breakdown of atmospheric resistance to this potential difference, leading to the upward lightning stroke. Upward-moving lightning is rare and having a flowering upward spread like the above is even rarer.
But does happen, with another example being an example of lightning spreading upwards from a transmitter tower in Slovakia:
From Cliff Mass Weather Blog
Weather Knowledge - 27
Observation of the onset of a blue jet into the stratosphere
Blue jets are lightning-like, atmospheric electric discharges of several hundred millisecond duration that fan into cones as they propagate from the top of thunderclouds into the stratosphere1. They are thought to initiate in an electric breakdown between the positively charged upper region of a cloud and a layer of negative charge at the cloud boundary and in the air above. The breakdown forms a leader that transitions into streamers2 when propagating upwards3.
However, the properties of the leader, and the altitude to which it extends above the clouds, are not well characterized4. Blue millisecond flashes in cloud tops5,6 have previously been associated with narrow bipolar events7,8, which are 10- to 30-microsecond pulses in wideband electric field records, accompanied by bursts of intense radiation at 3 to 300 megahertz from discharges with short (inferred) channel lengths (less than one kilometre)9–11.
Here we report spectral measurements from the International Space Station, which offers an unimpeded view of thunderclouds, with 10-microsecond temporal resolution. We observe five intense, approximately 10-microsecond blue flashes from a thunderstorm cell. One flash initiates a pulsating blue jet to the stratopause (the interface between the stratosphere and the ionosphere). The observed flashes were accompanied by ‘elves’12 in the ionosphere. Emissions from lightning leaders in the red spectral band are faint and localized, suggesting that the flashes and the jet are streamer ionization waves, and that the leader elements at their origin are short and localized.
We propose that the microsecond flashes are the optical equivalent of negative narrow bipolar events observed in radio waves. These are known to initiate lightning within the cloud and to the ground, and blue lightning into the stratosphere, as reported here.
Weather Knowledge - 26
The Stratosphere Has Warmed Profoundly This Month. What are the Implications?
Earlier this month, stratospheric temperatures warmed by roughly 100F over a period of a few days, in what is known as a Sudden Stratospheric Warming (SSW). Should you be concerned? The stratosphere, by the way, is the layer of the atmosphere from roughly 10 to 50 km above sea level.
As we will discuss, such stratospheric warmings are sometimes associated with distortions and alterations of the winds and temperatures in the lower atmosphere, resulting in anomalous weather from heat waves to snow storms. And major changes in the infamous polar vortex
There are actually two polar vortices: one high in the stratosphere and another in the troposphere.
The Warming
Early in January, the temperatures high in the polar stratosphere started to warm suddenly and profoundly. Take are look at this NASA plot of temperatures at a pressure at 10 hPa (roughly 85,000 ft above the surface) at the North Pole for this year (red/pink) and last year (blue) by date. The solid black line shows the average temperatures and the gray shading illustrates typical variability of the temperature at that location.
There was quite a warming in early January to about 250 K, roughly 50 K (or Celsius) above normal. That is 90F above normal! Wow.
This is a sudden stratosphere warming, something we typically see once a year in winter. You can view another such warming last winter in March of last year (blue colors).
Importantly, this month’s warming did not last long and is predicted to be gone completely during the next week. Why do such warmings occur? A lot of research has shown they are associated with high amplitude waves in the troposphere that propagate vertically into the stratosphere and disturb the flow there. Waves caused by mountain ranges and land-water contrasts, among other reasons. To understand the potential impacts of the stratosphere warming, let’s go back to the figure at the top of the blog, showing the two polar vortices (shown again below). During a normal winter period, there is an area of very cold air in the upper stratosphere near the North Pole, which is not surprising consider since there is virtually no solar heating! A jet westerly (from the west) jet stream (the polar night jet) surrounds the cold air and in fact creates a protective barrier around it.
In the lower atmosphere (troposphere), there is also cold air near the pole and a westerly jet at its southern boundary: commonly called the jet stream and strongest from roughly 25,000 to 35,000 ft above the surface. The undulations of the jet stream and the associated cold air to the north have a HUGE impact on weather near the surface. For example, a southward undulation can bring a cold wave and snow; a northward undulation, warm temperatures.How stratospheric warming affect surface weather When a polar stratosphere warming occurs, it is associated with strong sinking (which causes warming by compression); the weakening of the temperature difference between a cold pole and warmer air to the south causes the polar night jet to weaken and buckle, and the stratospheric polar vortex circulation weakens and can get distorted or even move off the pole. The effects of the stratosphere polar warming and undulations/distortions of the cold air tends to propagate downward into the troposphere, where the tropospheric polar vortex can weaken and the tropospheric jet stream become wavier. For the event of this month, it was clear that the upper jet stream weakened during the warming. To illustrate, here is the eastward-directed (zonal) winds at 60N for a level near the boundary between the stratosphere and troposphere (150 hPa pressure, about 45,000 ft). The winds (purple) dropped below normal after the warming began early in this month.
But has this stratospheric warming had a major impact on the undulations of the jet stream well down in the troposphere where we are?
To examine this, I plotted the difference from normal of the heights of the 500 hPa pressure surface (roughly 18,000 ft). You can think of this as pressure. And the plots show averages over one week. For the week prior to the warming (Dec. 26- January 1), there are a lot of strong anomalies (difference from normal)…including some anomalous ridging (high pressure over the pole).
The week following the warming (January 10-16th), the polar warming has weakened but perhaps has spread around a bit. Nothing to write home about. One big changing was the ridging (high pressure) over the West Coast and troughing over the eastern US., but hard to point at the warming as the cause. And, in fact, the eastern half of the U.S. has been relatively mild this winter…no severe cold outbreaks. And persistent blocking (locking up of the atmospheric flow) has been relatively absent this winter.
The latest European Center forecast for 500 hPa height anomalies (think of difference from normal of pressure at 18,000 ft), shows higher than normal heights over near the pole and a major trough (low pressure) over the western US. The kind of pattern that occurs more frequently in La Nina years (as this year is).
Weather Knowledge -25
WHAT IS FREEZING RAIN?
Freezing rain is a rare type of liquid precipitation that strikes a cold surface, and freezes almost instantly.
It tends to start its life as snow, ice, sleet or hail, but passes through a layer of air that’s above 0 °C on the way down to the ground, melting into a liquid water droplet.
Freezing rain is more common in other parts of the world, for example in the USA, but is not seen often in the UK.
A fog bow, sometimes called a white rainbow,[1] is a similar phenomenon to a rainbow; however, as its name suggests, it appears as a bow in fog rather than rain.[2]
A faint white or yellowish arc-shaped light that sometimes appears in fog opposite the Sun. A fogbow is similar to a rainbow but forms in a cloud or in fog.
Fogbows are far rarer to witness than rainbows, but they're not entirely unusual either.
The sun had just come up....and this is what I saw--an arch of white light, the fog bow.
And here is another shot. Pretty much all white...and much wider than a normal rainbow.
The fog bow is in the same location as a normal rainbow (opposite of the sun), but why no colors like a normal rainbow?
First, fog droplets--which are really cloud droplets-- are MUCH smaller than the raindrops that produce normal rainbows. Raindrops are typically 2000 microns (millionths of a meter) in size, cloud droplets are about 20 microns in size. To put it another way, raindrops are about 100 times as large as cloud/fog droplets.
So why does size matter?
For a normal rainbow, the sun's light enters the raindrop and reflects off the back. And the light is broken up into various wavelengths of light (different colors) as the light goes between the air and the droplet. The light is bent or refracted at the interface between air and water, with amount of bending dependent on the wavelength of light. This process is called dispersion.
But for a cloud droplet, something else happens at well. The droplet is so small that it is similar to the wavelength of visible light (roughly .5 microns) and the wave-like nature of light is revealed through a process called diffraction. Such diffraction cause the light to be scattered in a range of directions, mixing the colors together. Mixing all colors together gives you white.
We hear the term “subsidence” is weather every once in awhile. But what is it? To understand that, we have to know that it is usually associated with robust areas, or “domes” of High pressure. Warm moist air that has been lifted high up in the atmosphere by cold fronts and/or central Low pressure(s) eventually blends into High pressure, which is then sent outwards and downwards while cooling and condensing. The effect it has over warmers water below can appear as billowy looking cumulus types and can at times be called “cloud streeting”.
Basically it appears as Altocumulus clouds or can sink to create thicker Startocumulus clouds. Altocumulus:
Stratocumulus: So how would this affect winds?...In the U.S. .. For the east coast, High pressures over the NE US send down moderate to strong NE winds, also known as “the wedge”. Coastal areas with sunshine host a heating element between land and ocean tend to create additional speeds based on the pressure gradient increasing between cool air diving down over water and into land. If this subsidence pushes clouding over the coast, the heating element is thwarted and speeds can fall. Also, this subsidence can get thicker and if it a small area of low pressure or troughing develops, we can get convective cumulus clouding and rain. This tends to shift winds counter-clockwise and drops speeds even further.
Weather Knowledge - 22...30th October 2020
Article on research and study of Arabian Sea Storms done by Vineet Kumar (Vagarian) Reasercher IITM.
Huge explosive volcanic eruptions in the Tropics, energetic enough to push sulphur gases up into the stratosphere where they condense into aerosols, can have a cooling effect on climate by increasing the albedo.
As the stratosphere is very stable and there’ s little movement of material back down into the troposphere, this effect can last a couple of years. The combined eruptions of La Soufrière (1812), Mayon (1814) and Tambora (1815) had catastrophic global effects, leading to a ‘year with no summer’ in 1816. The eruption of Pinatubo in 1992 resulted in a global cooling of up to half a degree for a couple of years. Other recent energetic eruptions include El Chichon (1982) and Agung (1963) which were preceded by half a century of little volcanic activity.
In addition, volcanoes can themselves emit greenhouse gases. The eruption of Eyjafjallajökull in 2010 wasn’t powerful enough to push reflective material into the stratosphere. As the figure below shows, the amount of carbon dioxide the volcano emitted was less than the amount saved by the cancellation of European and trans-Atlantic flights. In addition, fewer flights means fewer contrails, which may have meant there was less high level cloud. What impact this may have on the climate is still being researched.
A more dramatic change in albedo is associated with the ‘snowball Earth’ hypothesis. It’s been suggested that during the Proterozoic (850-630 million years ago), the positive albedo feedback associated with ice accumulation led to ice covering the whole Earth. In this scenario, volcanoes and the huge amounts of greenhouse gases they can emit, would be necessary to warm the Earth again.
The difference between weather and climate is neatly summed up in the saying “the climate is what you expect; the weather is what you get”, frequently attributed to Mark Twain.
Climate is the average weather – for example the mean annual rainfall in Glasgow, the average January temperature in Paris, or how many hurricanes usually happen in the North Atlantic each year. However in any one year, it might be wetter or drier than usual in Glasgow, colder or warmer than usual in Paris or there may be more or less North Atlantic hurricanes, but this won’t necessarily affect the average unless there is a string of years the same.
Usually, the climate is defined as the average weather from the past 30 years
The weather can change from week to week or year to year, whilst the climate remains the same,.
Weather Knowledge - 19
Foehn effect
The foehn effect causes warming and drying of air on the lee side of cross mountain wind.
What is the foehn effect?In simple terms, this is a change from wet and cold conditions one side of a mountain, to warmer and drier conditions on the other (leeward) side.
Foehn winds (sometimes written "Föhn") are common in mountainous regions, regularly impacting the lives of their residents and influencing weather conditions for hundreds of kilometres downwind. Their notoriety has led to recognition by a multitude of names including: the Chinook or "snow eater" of the North American Rocky Mountains; the Zonda of the South American Andes; and the Helm wind of the English Pennines.
On 14 - 15 January 1972 in Montana, USA, a foehn chinook event was responsible for the greatest temperature change over a 24 hour period ever recorded in the United States: according to the US National Weather Service the temperature rose a staggering 57 °C; from -48 to 9 °C.
Foehn events are often accompanied by dramatic cloud formations above the mountains, such as towering lenticular clouds and lower-level rotor clouds. This is seen in the photo below revealing overturning and turbulence during a foehn event over the Antarctic Peninsula.
How does the foehn effect work?
Explanations of the foehn effect in popular literature or on the web often single out just one causal mechanism (#1 in the below), but there are in fact four known causes. These mechanisms often act together, with their contributions varying depending on the size and shape of the mountain barrier and on the meteorological conditions, for example, the upstream wind speed, temperature and humidity.
There are four mechanisms which combine to create the foehn effect:
1) Condensation and precipitation
When air is forced upwards over elevated terrain, it expands and cools due to the decrease in pressure with height. Since colder air can hold less water vapour, moisture condenses to form clouds and precipitates as rain or snow above the mountain's upwind slopes. The change of state from vapour to liquid water is accompanied by heating, and the subsequent removal of moisture as precipitation renders this heat gain irreversible, leading to the warm, dry foehn conditions in the mountain's lee. This mechanism has become a popular textbook example of atmospheric thermodynamics and it lends itself to attractive diagrams. However, the common occurrence of 'dry' foehn events, where there is no precipitation, implies there must be other mechanisms.
2) The draw-down of air from aloft
When the approaching winds are insufficiently strong to propel the low-level air up and over the mountain barrier, the air is said to be 'blocked' by the mountain and only air higher up near mountain-top level is able to pass over and down the lee slopes as foehn winds. These higher source regions provide foehn air that becomes warmer and drier on the leeside after it is compressed with descent due to the increase in pressure towards the surface.
3) Turbulent mixing
When river water passes over rocks, turbulence is generated in the form of rapids, and white water reveals the turbulent mixing of the water with the air above. Similarly, as air passes over mountains, turbulence occurs and the atmosphere is mixed in the vertical. This mixing generally leads to a downward warming and upward moistening of the cross-mountain airflow, and consequently to warmer, drier foehn winds in the valleys downwind.
4) Radiative warming
Dry foehn conditions are responsible for the occurrence ofrain shadowsin the lee of mountains, where clear, sunny conditions prevail. This often leads to greater daytime radiative (solar) warming under foehn conditions. This type of warming is particularly important in cold regions where snow or ice melt is a concern and/or avalanches are a risk.
Courtesy: Met Office U.K.
Weather knowledge - 18
Know about Cyclones Formations:
Whilst intense storms are very common throughout the Tropics, tropical cyclones need a very specific set of ingredients in order to form. These are:
• Warm ocean temperatures, greater than 26°C to a depth of at least 60m. Tropical cyclones only form over oceans, never over land, as they need sources of both heat and moisture. Even if the surface waters are very warm, the strong winds in a developing cyclone cause mixing of the surface layer of the ocean, bringing water up from below the surface. If this water is very much cooler than the surface, the supply of heat to the system will be reduced.
• Latitudes greater than 5° north or south of the equator. Cyclones are rotating systems and so only form in regions with a sufficient component of the Earth’s rotation about the local vertical (the Coriolis Effect) . This is zero on the equator itself and only becomes large enough to generate rotation within a weather system poleward of 5° of latitude.
• No large changes in wind speed and direction with height (known in meteorological terms as low wind shear). Cyclones rely on the development of tall columns of convective cloud which extend of the order of 10 km in the vertical. If the wind is changing too much with height, these columns of cloud cannot form through a great enough depth of the atmosphere as the tops will be constantly blown away.
• Lots of moisture through the depth of the atmosphere. As well as large wind shear, a dry atmosphere can also act to prevent deep columns of cloud forming.
• A pre-existing disturbance in the atmosphere. Tropical cyclones do not form spontaneously from nothing. There needs to be an area of enhanced thunderstorm activity which can act as a focus for the development of the cyclone in the presence of all the other conditions listed above. Forecasting the formation of tropical cyclones relies on early identification of these pre-existing disturbances and then recognising which ones will amplify into full-blown cyclones.
The development of tropical cyclones is a complex process and is still the subject of much research. In simple terms, a cyclone acts like an engine. It converts the energy available from a warm ocean surface into strong vertical air currents and horizontal wind speeds via the evaporation of warm water from the ocean surface and the subsequent condensation of this water vapour in deep columns of cloud around the centre of the storm. This deep cloud often forms an almost circular ring called the eyewall around the very centre of the storm which is itself free from clouds. Thankfully cyclones are rather inefficient engines, converting less than 10% of the available heat energy from condensation in the clouds into the mechanical energy of the motion of the winds.
There is an important positive feedback mechanism which allows cyclones to develop into intense systems. As the system starts to form, evaporation from the ocean surface acts as the source of heat and moisture for the formation of deep clouds. As these clouds intensify, strong rising currents of air in the eyewall around the storm centre. Near the surface, air is drawn into the centre of the storm to replace the rising air. This inrushing air near the surface results in strong winds which increase the evaporation from the ocean surface. This evaporation provides more heat and moisture to the clouds making the rising air currents within them stronger and thus intensifying the surface winds even further. As the system develops the Earth’s rotation acts on the inrushing winds, deflecting them into a pattern that rotates about the centre of the storm, spiralling in towards the centre.
A result of the mechanism for development described here is that the most severe weather, the heaviest rain and strongest winds, is strongly focused in the centre of the cyclone. In Figure 2 the diameter of the almost circular region of cloud associated with a Hurricane is about 800km. However, the most damaging winds and heaviest rain are all concentrated within the innermost 200km of the storm. The physics behind why there is sinking, warming and therefore clear air in the eye of the storm is still an area of active research.
The decay of a tropical cyclone usually occurs when the source of energy to the storm, the warm ocean surface, is removed. This may be due to the cyclone moving over land or into an ocean region with lower surface temperatures. An increase in vertical wind shear can also bring about the decay of a tropical cyclone.
Courtesy: University of Reading and Royal Meteorological Society
Weather Knowledge - 17
The Jetstream and The Weather
In order to understand the jet stream you need to have some idea of what is occurring in the atmosphere nearest the ground; known as the troposphere. It is also helpful to understand the formation of Hadley, Ferrel and Polar cells and how The Coriolis Effect influences these tropospheric cells. The jet stream flows in both hemispheres around the earth, but for ease this article will consider the Northern Hemisphere only.
The jet stream is a strong flowing ribbon of air that flows around our planet high up in the atmosphere, at around the level of the tropopause. Situated between the troposphere and the stratosphere, the Jet Stream is approximately 11 kilometres above the surface of the Earth at the poles and around 17 kilometres above the surface of the Earth at the equator. The jet stream flows at around 160kmph (100mph). We often hear that the jet stream is responsible for influencing the weather in the UK, so it is natural to wonder what causes the jet stream and why it has such an influence on the weather we experience on the ground.
Jet streams form and are strongest where variable air temperature gradients are steepest. This is normally seen in two zones:
The boundary between the polar and mid latitude air . The Polar Front Jet or Polar jet
The boundary between the mid latitude air and tropical air . The Subtropical Jet.
Both these jets are separate entities but they can join up from time to time across an area of the earth. The polar jet is the strongest as the temperature gradient across Polar and mid latitude regions is greatest. This is increased again in the Northern Hemisphere during winter. Both the subtropical jet and the polar jet travel from west to east and both would travel uniformly and evenly around the earth if it wasn.t for other influencing factors.
See Fig 1. below for an example of a typical jet stream chart across the earth.
Typical JetStream Click to enlarge
Fig 1: The jet stream is shown in red at its strongest point fading to yellow at its weakest. The STJ is the area where the subtropical jet is flowing, the PJ is an area where the polar jet flows and the P&STJ shows where the jet streams have combined.
Influencing factors on the Jet Stream flow The factors that influence the flow of the jet stream are the landmasses and the Coriolis effect. Landmasses interrupt the flow of the jet stream through friction and temperature differences, whilst the spinning nature of the earth accentuates these changes. So the jet stream meanders across the earth, like a river meanders before it reaches the sea. The meandering sections of the jet stream continue to change as they interact with landmasses once again, creating an ever-changing state of flux and subsequent temperature differences.
In winter the temperature of the stratosphere can also have an effect on the strength and position of the jet stream. The cooler the polar stratosphere, the stronger the polar/ tropical differential becomes; encouraging the jet stream to gain in strength. The warmth of the landmasses and oceans (such as the El Nino Southern Oscillation) can also have a bearing on the strength and amplitude of the jet stream.
Jet Stream Variables The strongest areas of the jet stream are known as jet streaks. These are areas where the jet stream has increased in speed by as much as 100kmph. A typical jet streak is 160km wide, 2-3 km thick and lasting several hundred km in length. The strongest jet streams are seen where the upper air temperature differentials are greatest, the weakest jet streams appear when the opposite is true. Strong jet streams tend to have very little meandering associated with them whereas weaker jet streams have a considerable amount of meandering associated with them.
A Summary of the Jet Stream
Jet streams are strong upper air currents circumnavigating the globe.
There are two main jets: the polar jet and the subtropical jet.
Jet streams can fluctuate in strength between 100-200mph.
The jet stream meanders in waves.
How does the jet stream affect the weather in the UK? To try explain how the jet stream affects the weather in the UK, it is worth going back to the jet stream chart seen in Fig 1, now zoom in to the jet stream analysis over the Atlantic as seen in Fig 2.
Jet Analysis Click to enlarge
The jet stream is shown in pink at its strongest point fading to yellow at its weakest. CA=cold polar air, WA=warmer air, PJ=polar jet, STJ=subtropical jet, JS=jet streak.
From Fig 2. you can see that the polar front jet meanders across the country in a wave like pattern. These waves introduce pockets of colder air southwards and warmer northwards. The temperature change is demonstrated by looking at the air temperature at a high enough altitude in the atmosphere, where ground and sea temperatures do not affect it .around 1500 metres in altitude where the air pressure is around 850 hPa.
Fig 3. shows how these temperatures match the fluctuations in the jet stream.
Jet + 850hpa Temps Click to enlarge
From looking at Fig 3 and the 850-hPA temperatures you can see the clear boundaries between the cold and warm air masses, which is being divided by the polar jet. You can also see the demarcation between warm and hot air that the sub tropical jet is demarcating. This demonstrates the pattern of the jet stream, showing how it is linked to and by the difference in warmer and cooler air masses.
Furthermore, looking back at FIG 2, the wave pattern associated with the polar jet has distinct peaks (ridges) and troughs. It is no surprise to find that when we overlay the jet stream with a chart showing sea level pressure, that the ridges occur where sea level pressure is highest and the troughs occur where sea level pressure is lowest (as FIG 4 demonstrates). This is because air rises where troughs are situated and sinks where ridges are occur. Rising and sinking parcels of air will therefore determine the type of weather that a region experiences.
Ridges and Troughs Click to enlarge
R=ridge, T=trough, X=deep sea level depression or low.
Look at the area X on Fig 4. which is situated towards the west of Iceland. This is a common cyclonic or baroclinic depression that is caused by the difference in pressure and temperature over a region. This is feeding strength to the jet stream, which is then invigorating the depression.
In contrast, Fig 5 shows the same chart from FIG 2. However, note the following points:
The circled area is where the jet stream is strongest . the jet streak.
The purple box marks the winds entering the jet streak.
The winds leaving the jet streak are marked by the black box.
The winds leaving the jet streak are rapidly diverging, creating a lower pressure at the upper level (tropopause) in the atmosphere. The air below rapidly replaces the upper outflowing winds. This in turn creates the low pressure at the surface (marked X on fig 4). This surface low pressure creates conditions where the surrounding surface winds rush inwards. The Coriolis effect creates the cyclonic rotation that is associated with depressions. The strongest surface winds in any developing depression are normally seen at the left exit point of the jet streak, where the jet streak is strongest.
Jetstreak Click to enlarge
Fig 5: The black oval indicates a jet streak, the purple square indicates entry winds into the jet streak and black box indicates rapidly diverging exit winds.
The positioning and strength of the jet stream determines where ridges and troughs are associated and this in turn influences the surface weather.
Zonality and Meridional flow. During periods when the jet stream is flat and strong with little amplification or meandering, the UK is likely to experience weather that is driven straight in from the Atlantic. This is characterized by wet and windy weather with temperatures near to average. This condition is often termed .zonality. as the warm and cold air masses are clearly defined by a straight fast flowing jet.
During periods when the jet stream is amplified (such as Fig2) the pattern will be different. This is often termed meridional with polar air travelling further south than usual and warmer sub tropical air travelling further north. The exact positioning of the amplification of the jet stream will determine whether or not the UK is in cold polar air or warmer air from lower latitudes. If a meridional pattern becomes stagnant then the UK may experience either of these conditions for a period of time and the pattern may be known as .blocked..
Summary of the Jet Stream and the weather it creates:
The position of the jet stream over the UK determines the type of weather we experience.
If the polar front jet is situated significantly to the south of the UK we will experience colder than average weather.
If the polar front jet is situated to the north of the UK we will experience warmer than average weather.
If the polar front jet is situated over the UK we will experience wetter and windier than average weather.
If the polar front jet has a large amplification then cold air will travel further south than average and warm air will travel further north than average.
The direction and angle of the jet stream arriving at the UK will determine what source of air (i.e. cold, dry, warm, wet, from maritime or continental sources) the UK experiences.
Article written by Ed O'Toole
Weather Knowledge - 16
High and Low Pressure areas.
We live on a planet that rotates, so this simple wind pattern is distorted to such a degree that the air is twisted to the right of its direction of motion in the Northern Hemisphere and to the left in the Southern Hemisphere. Today we know this effect as the Coriolis Force and as a direct consequence, great wind spirals are produced which we know as high and low pressure systems.
In the Northern Hemisphere, the air in low pressure areas spirals counterclockwise and inward — hurricanes, for instance, are Coriolis mechanisms, circulating air counterclockwise. In contrast, high pressure systems the air spirals clockwise and outward from the center. In the Southern Hemisphere the direction of the spiraling of the air is reversed.
So why do we generally associate high pressure with fair weather and low pressure with unsettled weather?
High pressure systems are “domes of density” that press down, while low pressure systems are akin to “atmospheric valleys” where the density of the air is less. Since cool air has less of a capacity to hold water vapor as opposed to warm air, clouds and precipitation are caused by cooling the air.
So by increasing the air pressure, the temperature rises; underneath those high pressure domes, the air tends to sink (called “subsidence”) into the lower levels of the atmosphere where temperatures are warmer and can hold more water vapor. Any droplets that might lead to the formation of clouds would tend to evaporate. The end result tends to be a clearer and drier environment.
Conversely, if we decrease the air pressure, the air tends to rise into the higher levels of atmosphere where temperatures are colder. As the capacity to hold water vapor diminishes, the vapor rapidly condenses and clouds (which are composed of countless billions of tiny water droplets or, at very high altitudes, ice crystals) will develop and ultimately precipitation will fall. Of course, we could not forecast zones of high and low pressure without employing some sort of device to measure atmospheric pressure.
Weather Knowledge - 15
The Coriolis Force (also called the Coriolis Effect)
The Coriolis Effect is named after 19th-century French engineer-mathematician Gustave-Gaspard Coriolis. In 1835 he expanded on Sir Isaac Newton’s 3 laws of motion; by describing how an inertial force acts upon things with in a rotating frame of reference. This force is to the right of the direction of body travel for counterclockwise rotation of the reference frame or to the left for clockwise rotation.
It affects weather patterns, it affects ocean currents, and it even affects air travel. The Coriolis Effect makes things (like planes or currents of air) traveling long distances around the Earth appear to move at a curve as opposed to a straight line. This is the reason; air tends to rotate counterclockwise around large-scale low-pressure systems and clockwise around large-scale high-pressure systems in the Northern Hemisphere. In the Southern Hemisphere, the flow direction is reversed. .
Most of us can agree that the Earth is a very large round object that is rotating on its axis. We can also agree that a day is the length of time it takes the Earth to make one rotation on that axis, which is 24 hours. If this is true, then depending on latitude parts of the Earth are moving at different speeds.
That might sound crazy, but think of it like this. If one of y’all were standing a foot to the right of the North Pole, this would make the circumference of that circle about 6 feet. It would take 24 hours for that spot to rotate back around that circle on a round rotating Earth. That’s about 0.00005 miles per hour. OK now we move and stand on the equator. The day is still 24 hours long; but the circle circumference is much bigger. At the equator the Earth's circumference is about 25,000 miles. Which would mean you’re moving about 1040 miles per hour just by standing there. So even though we are all on Earth, how far we are from the equator determines our forward speed. The farther we are from the equator, the slower we move.
Okay how does this stop things like hurricanes from moving in a straight line? Going back to our imaginary surroundings. This time we’re moving at 70 mph down the interstate. As we move, we come up on a slower moving bus. As we pass the bus, we see an open window. Since you have a baseball in your hand, you decide to try and throw that ball through the window. You take aim, and make an extraordinary dead on throw. But in spite of that, the baseball travels to the side and misses the window. That’s because the ball is traveling not only in the direction of the window, but it is also going in the direction (and speed) of your car. And that’s the deflection we are talking about!
Anything traveling long distances, like air currents, ocean currents, even hurricanes and airplanes, will all be deflected because of the Coriolis Effect! Uncanny but weirdly true.
Credit WX4cast Rebecca Ladd
Weather Knowledge - 14
Disclaimer: This page is kept for historical purposes, but the content is no longer actively updated
What is the coldest place on Earth?
It is a high ridge in Antarctica on the East Antarctic Plateau where temperatures in several hollows can dip below minus 133.6 degrees Fahrenheit (minus 92 degrees Celsius) on a clear winter night.
Scientists made the discovery while analyzing the most detailed global surface temperature maps to date, developed with data from remote sensing satellites including the new Landsat 8, a joint project of NASA and the U.S. Geological Survey (USGS). Ted Scambos, lead scientist at the National Snow and Ice Data Center in Boulder, Colo., joined a team of researchers reporting the findings Monday at the American Geophysical Union meeting in San Francisco.
Researchers analyzed 32 years' worth of data from several satellite instruments. They found temperatures plummeted to record lows dozens of times in clusters of pockets near a high ridge between Dome Argus and Dome Fuji, two summits on the ice sheet known as the East Antarctic Plateau. The new record of minus 136 F (minus 93.2 C) was set Aug. 10, 2010.
That is several degrees colder than the previous low of minus 128.6 F (minus 89.2 C), set in 1983 at the Russian Vostok Research Station in East Antarctica. The coldest permanently inhabited place on Earth is northeastern Siberia, where temperatures in the towns of Verkhoyansk and Oimekon dropped to a bone-chilling 90 degrees below zero Fahrenheit (minus 67.8 C) in 1892 and 1933, respectively.
"We had a suspicion this Antarctic ridge was likely to be extremely cold, and colder than Vostok because it's higher up the hill," Scambos said. "With the launch of Landsat 8, we finally had a sensor capable of really investigating this area in more detail."
The quest to find out just how cold it can get on Earth -- and why -- started when the researchers were studying large snow dunes, sculpted and polished by the wind, on the East Antarctic Plateau. When the scientists looked closer, they noticed cracks in the snow surface between the dunes, possibly created when wintertime temperatures got so low the top snow layer shrunk. This led scientists to wonder what the temperature range was, and prompted them to hunt for the coldest places using data from two types of satellite sensors.
The coldest place on earth is in the East Antarctic Plateau, but not at the highest peak. Rather, the coldest spots develop just downhill from a ridge that runs from Dome A to Dome Fuji. Movie
They turned to the Moderate Resolution Imaging Spectroradiometer (MODIS) instruments on NASA's Terra and Aqua satellites and the Advanced Very High Resolution Radiometer (AVHRR) on several National Oceanic and Atmospheric Administration satellites. These sensitive instruments can pick up thermal radiation emitted from Earth's surface, even in areas lacking much heat.
Using these sensors to scan the East Antarctic Plateau, Scambos detected extremely cold temperatures on a 620-mile stretch of the ridge at high elevations between Argus and Fuji, and even colder temperatures lower elevations in pockets off the ridge. Then, with the higher resolution of the Thermal Infrared Sensor (TIRS) aboard Landsat 8, the research team pinpointed the record-setting pockets.
The team compared the sites to topographic maps to explore how it gets so cold. Already cold temperatures fall rapidly when the sky clears. If clear skies persist for a few days, the ground chills as it radiates its remaining heat into space. This creates a layer of super-chilled air above the surface of the snow and ice. This layer of air is denser than the relatively warmer air above it, which causes it to slide down the shallow slope of domes on the Antarctic plateau. As it flows into the pockets, it can be trapped, and the cooling continues.
"By causing the air to be stationary for extended periods, while continuing to radiate more heat away into space, you get the absolute lowest temperatures we're able to find," Scambos said. "We suspected that we would be looking for one magical site that got extremely cold, but what we found was a large strip of Antarctica at high altitude that regularly reached these record low temperatures."
This narrated animation shows the process by which the coldest place on Earth develops its extreme low temperatures. Play it
The study is an example of some of the intriguing science possible with Landsat 8 and the TIRS instrument, which was built at NASA’s Goddard Space Flight Center in Greenbelt, Md. Since its launch Feb. 11, Landsat 8 has captured approximately 550 scenes per day of Earth's land surface. USGS processes, archives and distributes the images free of charge over the Internet.
"With Landsat 8, we expect to see more accurate and more detailed maps of the landscape than we've ever been able to see," said James Irons, the mission's project scientist at Goddard. "If change is occurring, I think we'll be able to detect it earlier and track it."
Researchers also are eager to see what new results come out of Landsat 8, both from icy plateaus and Earth's warmer regions.
"What we've got orbiting Earth right now is a very accurate and consistent sensor that can tell us all kinds of things about how the land surface of Earth is changing, how climate change is impacting the surface of Earth, the oceans of Earth, and the icy areas of Earth," Scambos said. "Finding the coldest areas on Earth is just the beginning of the discoveries we're going to be able to make with Landsat 8."
Rain VS ShowersWhat is the difference between the terms Rain and Showers.
When you hear or see showers on the forecast do you think, there won’t be very much and when you the term rain is used do you think, it will be soaking?
The difference between the two is kind of tricky and subtle. There is no doubt that showers are indeed rain. Taking at face value the term rain or showers, has nothing to do with how much precipitation is going to fall. Instead it tells you how it is going to fall. It has to do with the type of cloud they come from.
What are showers?
A shower is a short duration event, that can last a couple of minutes to perhaps 15 minutes or so. But they can sometime last over half an hour. They typically start quickly and end quickly. There can be heavy downpours when dealing with showers.
Showers come from Cumuliform clouds - Cumulus or Cumulonimbus (thunderstorm) the puffy ones that look like they are bubbling up. often separated by blue sky. Showers are pushed around by the wind, so you only experience a particular shower if you are in its path Since they are hit and miss, your house could be getting wet, while your next-door neighbor could be dry. Cumulus normally result in lower totals while amounts can get quite high from Cumulonimbus.
The customary way of talking about them is isolated showers or scattered/widespread showers. Because they are hit and miss you will never see 100% chance of showers.
Cumulus
Cumulonimbus
Cumulonimbus
What is rain?
Rain is a moderate to long duration event. That can last for a couple of hours to all day. It typically starts gradually then ramps up and ends gradually.
Rain comes from Stratiform clouds- Altostratus and Nimbostratus. These types of clouds are more or less featureless and cover the sky in a grey, widespread sheet, with little to no blue sky to be seen, and of the two, Nimbostratus is thicker and produces heavier rains.
Rain covers a wide area, so most or everyone over a large area are getting wet. Rain can come down lightly or heavily. Because of its long-lasting duration, it can lead to flooding issues.
These are altocumulus clouds with strong upward motion in them producing precipitation, in this case snow, falling in streaks and not reaching the ground (“virga”). They form when the upper troposphere is unstable, and warm advection (a warm air mass moving into a cool air mass) produces the uplift.
A derechois a widespread, long-lived, straight-line wind storm that is associated with a fast-moving group of severe thunderstorms known as a mesoscale convective system.
A derecho-producing convective system may remain active for many hours and, occasionally, over multiple days.
A warm-weather phenomenon, derechos occur mostly in summer, especially during June, July, and August in the Northern Hemisphere, within areas of moderately strong instability and moderately strong vertical wind shear. However, derechos may occur at any time of the year, and can occur as frequently at night as during the day.
A common definition is a thunderstorm complex that produces a damaging wind swath of at least 400 km (250 miles), featuring a concentrated area of convectively-induced wind gusts exceeding 30 m/s (90 km/h; 50 kn; 60 mph).
Organized areas of thunderstorm activity reinforce pre-existing frontal zones, and can outrun cold fronts. The resultant mesoscale convective system (MCS) often forms at the point of the strongest divergence of the upper-level flow in the area of greatest low-level inflow and convergence. The convection tends to move east or toward the equator, roughly parallel to low-level thickness lines and usually somewhat to the right of the mean tropospheric flow. When the convection is strongly linear or slightly curved, the MCS is called a squall line, with the strongest winds typically occurring just behind the leading edge of the significant wind shift and pressure rise.
Classic derechos occur with squall lines that contain bow- or spearhead-shaped features as seen by weather radar that are known as bow echoes or spearhead echoes. Squall lines typically "bow out" due to the formation of a mesoscale high pressure system which forms within the stratiform rain area behind the initial convective line. This high pressure area is formed due to strong descending air currents behind the squall line, and could come in the form of a downburst The size of the bow may vary, and the storms associated with the bow may die and redevelop.
Global Warming Theory in a Nutshell..Roy Spencer Ph.D. Climatologist.
(Updated June 3, 2019)
Every scientific theory involves assumptions. Global warming theory starts with the assumption that the Earth naturally maintains a constant average temperature, which is the result of a balance between (1) the amount of sunlight the Earth absorbs, and (2) the amount of emitted infrared (“IR”) radiation that the Earth continuously emits to outer space.
In other words, energy in equals energy out. This is the same concept that governs the temperature of anything; if energy is gained faster than it is lost, warming occurs… but if energy is lost faster than it is gained, cooling occurs.
Averaged over the whole planet for 1 year, the energy flows in and out of the climate system are estimated to be around 235 to 240 watts per square meter. We don’t really know for sure because our global observations from spaceborne satellite instruments are not accurate enough to measure those flows of radiant energy.
“Greenhouse” components in the atmosphere (mostly water vapor, clouds, carbon dioxide, and methane) exert strong controls over how fast the Earth loses IR energy to outer space. Mankind’s burning of fossil fuels creates more atmospheric carbon dioxide. As we add more CO2, slightly less infrared energy is lost to outer space, strengthening the Earth’s greenhouse effect. This causes a warming tendency in the lower atmosphere and at the surface, and at the same time causes the upper atmosphere (especially the stratosphere) to cool. From an energy standpoint, it’s similar to adding insulation to the walls of a heated house in the winter; for the same rate of energy input (no thermostat), the result will be that the walls are warmer on the inside, and colder on the outside. This is analogous to the greenhouse effect of our atmosphere insulating the Earth’s surface from the “cold” depths of outer space.
It is believed (based upon theoretical calculations) that our global emissions of carbon dioxide have enhanced the Earth’s natural greenhouse effect by about 1%, thus reducing the rate at which IR energy is lost to outer space. Global warming theory (through conservation of energy) says that the lower atmosphere must then respond to this energy imbalance (less IR radiation being lost than solar energy being absorbed) by causing an increase in temperature. This warming then increases the IR escaping to space until the emitted IR radiation once again reaches a balance with absorbed sunlight, and the temperature stops rising. This is the basic explanation of global warming theory.
Manabe and Strickler (1964) calculated the global-average strength of the “greenhouse effect” on surface temperatures assuming all energy transfers were radiative (no weather processes), based upon the theory of how infrared energy courses through the atmosphere. They found that the surface of the Earth would average a whopping 75 deg. C warmer than if there was no greenhouse effect. But in reality, the surface of the Earth averages about 33 deg. C warmer, not 75 deg. C warmer than a no-greenhouse Earth. That’s because convective air currents (which create weather) carry excess heat away from the surface, cooling it well below its full greenhouse effect value represented by their imagined “pure radiative energy equilibrium” assumption.
Now, you might be surprised to learn that the amount of warming directly caused by us adding extra CO2 to the atmosphere is, by itself, relatively weak. It has been calculated theoretically that, if there are no other changes in the climate system, a doubling of the atmospheric CO2 concentration would cause about 1 deg C of surface warming. This is NOT a controversial statement…it is well understood by climate scientists. As of early 2019, we were about 50% of the way toward a doubling of atmospheric CO2.
But everything else in the climate system probably won’t stay the same. For instance, clouds, water vapor, and precipitation systems can all be expected to respond to the warming tendency in some way, which could either amplify or reduce the manmade warming. These other temperature-dependent changes are called “feedbacks,” and the sum of all the feedbacks in the climate system determines what is called ‘climate sensitivity’. Negative feedbacks (low climate sensitivity) would mean that manmade global warming might not even be measurable, lost in the noise of natural climate variability. But if feedbacks are sufficiently positive (high climate sensitivity), then manmade global warming could be catastrophic.
Obviously, knowing the strength of feedbacks in the climate system is critical, and is the subject of much of my research. Here you can read about some of my work on the subject, in which I show that feedbacks previously estimated from satellite observations of natural climate variability have potentially large errors. A confusion between forcing and feedback (loosely speaking, cause and effect) when observing cloud behavior has led to the illusion of a sensitive climate system, when in fact our best satellite observations (when carefully and properly interpreted) suggest an IN-sensitive climate system.
Finally, if the climate system is insensitive, this means that the extra carbon dioxide we pump into the atmosphere is not enough to cause the observed warming over the last 100 years — some natural mechanism must be involved. Here you can read about one candidate: the Pacific Decadal Oscillation, which reflects whether we are in a multi-decadal period of stronger El Ninos (which produce global warmth) or La Nina (which produces global coolness). Other possibilities for natural changes in the climate system also exist.
The most important thing to remember about climate models which are used to project future global warming is that they were “tuned” with the assumption I started this article with: that the climate system is in a natural state of energy balance, and that there is no long-term climate change unless humans cause it.
This is an arbitrary and illogical assumption. The climate system is an example of a “nonlinear dynamical system”, which means it can change all by itself. For example, slow changes in the rate of vertical overturning of the world’s oceans can cause global warming (or global cooling) with no “external forcing” of the climate system whatsoever.
Instead, the climate models are “tuned” to not produce natural climate change. If a 100-year run of the model produces change, the model is adjusted to removed the “drift”. The models do not produce global energy balance from “first physical principles”, because none of the processes controlling that balance are known to sufficient accuracy. Instead, the models are “fudged” to produce energy balance, based upon the modelers’ assumption of no natural climate change. Then, the models are used as “proof” that only increasing CO2 has caused recent warming.
This is circular reasoning.
I am not against modeling; models are necessary to understand complex processes in the climate system. But, while the models are useful and necessary tools for studying climate change, I do not think they can yet be relied upon for major changes in energy policy.
The Radar Shows Heavy Rain Offshore Without Clouds: How Can That Be?
The radar imagery from the National Weather Service Langley Hill radar near Hoquiam showed heavy showers over the coastal waters last night. To illustrate, here is the radar imagery over the Northwest for 1:14 AM this morning. The reds indicate heavy precipitation! Was it pouring offshore?
A look at the infrared satellite image at the same time shows no weather disturbances out there (see below). Just some clouds to the north (associated with system that will bring us rain on Saturday).
A high resolution visible satellite image taken just before sunset on Thursday confirms the lack of weather offshore. But note the low stratus and fog right along the coast....that will be important later!
So is the expensive Langley Hill radar broken? Is rain falling out of clear skies? Is there an explanation for this mystery?
There is an answer: super bending of the Langley Hill radar beam by an unusually strong and low inversion, where temperature increases with height.
Let us take a look at the vertical sounding of temperature, dew point, and winds with height from the balloon-borne radiosonde released at Forks, on the Washington coast, around 5 AM this morning.
Note how temperature (the right-hand line) increases with height in the lower atmosphere. That represents an inversion. The left line is dew point temperature; when dew point and temperature are the same, the air is saturated, which was true near the surface.
Yesterday afternoon, cool, but shallow, marine air moved into the coast, while warm air remained aloft. The result was a fairly strong inversion in the lower atmosphere. The visible satellite image showing the low clouds on the coast were a hint of what was going on.
So why do we care about inversions? Because they can bend the radar beams (which are in the microwave portion of the electromagnetic spectrum--around 10 cm in wavelength).
A strong inversion can bend the radar beam down to the earth's surface in what is known as superrefraction (see image). The earth's surface (in this case the ocean) is a pretty decent reflector of the radar signal and a good amount propagates back to the radar, giving a false signal of heavy precipitation. That is why the radar showed the arc of supposedly heavy rain offshore. Totally bogus.
Now in the typical atmosphere, with denser air at low levels and less dense air above, there is normally some bending of the radar beam, which is a good thing because it gives the radar greater range (see below)
One of the most extraordinary and beautiful sights this time of year are the delicate noctilucent clouds that can appear after sunset and before sunrise.
Noctilucent clouds are the highest visible clouds, located around 50 miles above the earth surface.
The first report of noctilucent clouds was in 1885 and a number of studies suggest that such clouds are getting more frequent.
The Article below is informative as to why we call it "Cyclone"..taken from Prof. Ranjan Kelkar's Blog "Through Cloud and Sunshine".
Cyclone, the Coil of a Snake
June 7, 2020
The word ‘cyclone’ was coined in India in 1840, thirty five years before the India Meteorological Department was established, by a man named Henry Piddington, a seafarer who became a judge who then became a meteorologist. Born in 1797, Piddington served first as a British sea captain, and was later appointed as the President of the Marine Courts of Enquiry at Calcutta (now Kolkata). Presumably, Piddington’s job would have required him to investigate cases of shipwreck and damage to ships caught in storms at sea and to settle claims. However, his interest began to wander far beyond the application of maritime law and he started examining the storms themselves.
In December 1789, a storm had struck disaster on the east coast of India, killing over 20,000 people. Piddington made a thorough investigation of this devastating storm and presented his results before the Asiatic Society of Bengal at Calcutta in 1840. In his paper, he described the storm as a ‘cyclone’, a name he had derived from the Greek word ‘kuklos’ meaning going around, or encircling, like the coil of a snake.
Piddington thereafter continued with his investigations of storms not only in the Indian seas but around ocean basins all over the world. By 1848, he had done such extensive research that he published a book with this long title: “The Sailor’s Horn-Book for the Law of Storms: Being a Practical Exposition of the Theory of the Law of Storms, and Its Uses to Mariners of All Classes in All Parts of the World, Shewn by Transparent Storm Cards and Useful Lessons”.
In the year 1840, when there was no official meteorological agency in India, when so little was known about the atmospheric and oceanic processes, when there were no weather radars and satellites, Piddington could perceive that a cyclone would look like a coil of a snake if seen from the sky above. He explained in his book how he arrived at this new word ‘cyclone’:
“I am not altogether averse to new names, but I well know how sailors, and indeed many landsmen, dislike them; I suggest, however, that we might perhaps for all this last class of circular or highly curved winds, adopt the term ‘Cyclone’ from the Greek ‘kuklos’ (which signifies amongst other things the coil of a snake) as neither affirming the circle to be a true one, though the circuit may be complete, yet expressing sufficiently the tendency to circular motion in these meteors. We should by the use of it be able to speak without confounding names which may express either straight or circular winds – such as ‘gale, storm, hurricane,’ &c. – with those which are more frequently used to designate merely their strength. This is what leads to confusion, for we say of, and we the authors ourselves write about, ships and places in the same ‘storm’ having ‘the storm commencing’, ‘the gale increasing’, ‘the hurricane passing over’ and the like; merely because the ships or localities of which we speak had the wind of different degrees of strength, though the whole were experiencing parts of the same circular storm. ‘Cycloidal’ is a known word, but it expresses relation to a defined geometrical curve and one not approaching our usual views, which are those of something nearly, though not perfectly, circular. Now if we used a single word and said ‘the cyclone commenced, increased, passed over, &c.’, we shall get rid of all this ambiguity, and use the same word to express the same thing in all cases; and this without any relation.”
We got the first glimpse of a cyclone from outer space in 1960. Since then, we have become very familiar with how a tropical cyclone looks like from space, Television news channels often present animated sequences of the images that clearly show the cloud bands swirling around the centre or the eye of the cyclone, like the coil of a snake. What Piddington could only have imagined, we are actually seeing today.
Today, however, tropical cyclones are called by this original name only in India and the adjoining seas, Arabian Sea, Bay of Bengal, and the Indian Ocean. Over the Atlantic Ocean, they are known as hurricanes, and over the Pacific as typhoons.
Henry Piddington, the captain-turned-judge-turned-meteorologist, was also engaged in scientific research in varied disciplines like botany, geology, mineralogy and soil chemistry. He published numerous papers in the Journal of the Asiatic Society of Bengal and compiled the ‘English Index to the Plants of India’. He died at Calcutta in 1858.
In the first few days of the lockdown, it was difficult to observe a change in the pollution signature. “We saw an aerosol decrease in the first week of the shutdown, but that was due to a combination of rain and the lockdown,” said Gupta. Around March 27, heavy rain poured over vast areas of northern India and helped clear the air of aerosols. Aerosol concentrations usually increase again after such heavy precipitation.
“After the rainfall, I was really impressed that aerosol levels didn’t go up and return to normal,” Gupta added. “We saw a gradual decrease, and things have been staying at the level we might expect without anthropogenic emissions.”
The chart above shows daily average aerosol optical depth measurements over northern India from January 1 to April 5, 2020, as compared to the 2016-2019 average. Note that the rise in AOD at the end of February coincided with fire activity in the Indian state of Punjab and in neighboring Pakistan.
According to Gupta, AOD levels in northern India at the beginning of April were significantly below the norm for this time of year and the lowest in 20 years of MODIS observations. Ground observation stations in India have also reported a decrease in particle pollution in the region. Anecdotally, people in the northern state of Punjab have reported seeing the Himalayas for the first time in decades.
In southern India though, the story is a little hazier. Satellite data show aerosol levels have not yet decreased to the same extent; in fact, levels seem to be slightly higher than in the past four years. The reasons are unclear, but could be related to recent weather patterns, agricultural fires, winds, or other factors.
“This a model scientific experiment,” said Levy about the lockdown and its effects on pollution. “We have a unique opportunity to learn how the atmosphere reacts to sharp and sudden reductions in emissions from certain sectors. This can help us separate how natural and human sources of aerosols affect the atmosphere.”
International Boundaries in this map are incorrect
On March 25, 2020, the Indian government placed its 1.3 billion citizens under a strict lockdown to reduce the spread of the COVID-19 coronavirus. The country-wide mandate decreased activity at factories and severely reduced car, bus, truck, and airplane traffic. After just a week of reduced human activities, NASA satellite sensors observed aerosol levels at a 20-year low for this time of year in northern India.
Every year, aerosols from anthropogenic (human-made) sources contribute to unhealthy levels of air pollution in many Indian cities. Aerosols are tiny solid and liquid particles suspended in the air that reduce visibility and can damage the human lungs and heart. Some aerosols have natural sources, such as dust storms, volcanic eruptions, and forest fires. Others come from human activities, such as the burning of fossil fuels and croplands. Human-made aerosols tend to contribute most of the smaller particles that have greater potential for damaging human health.
“We knew we would see changes in atmospheric composition in many places during the lockdown,” said Pawan Gupta, a Universities Space Research Association (USRA) scientist at NASA’s Marshall Space Flight Center. “But I have never seen aerosol values so low in the Indo-Gangetic Plain at this time of year.”
The first five maps above show aerosol optical depth (AOD) measurements over India during the same March 31 to April 5 period for each year from 2016 through 2020. The sixth map (anomaly) shows how AOD in 2020 compared to the average for 2016-2019. Aerosol optical depth is a measure of how light is absorbed or reflected by airborne particles as it travels through the atmosphere. If aerosols are concentrated near the surface, an optical depth of 1 or above indicates very hazy conditions. An optical depth, or thickness, of less than 0.1 over the entire atmospheric vertical column is considered “clean.” The data were retrieved by the Moderate Resolution Imaging Spectroradiometer (MODIS) on NASA’s Terra satellite.
In a typical early spring in the Ganges Valley of northern India, human activities generate the majority of aerosols. Motor vehicles, coal-fired power plants, and other industrial sources around urban areas produce nitrates and sulfates; coal combustion also produces soot and other carbon-rich particles. Rural areas add smoke—rich in black carbon and organic carbon—from cooking and heating stoves and from prescribed burns on farms (though farming fires more often occur at other times of year). By all accounts, the 2020 lockdown reduced those human-made emission sources.
Scientists expect aerosol levels to increase slightly in upcoming weeks in parts of India as seasonal dust storms begin. Dust concentrations are typically low in March and early April, before temperatures rise and strong westerly winds blow sand in from the Thar Desert and Arabian Peninsula. The question is whether overall AOD will remain below normal.
“The hard part with understanding aerosols is that particles can move based on wind patterns and other meteorology,” said Robert Levy, program leader for NASA’s MODIS aerosol products. “You have to disentangle what is caused by the human fingerprint versus a meteorological factor.
NASA Earth Observatory images by Joshua Stevens, using Terra MODIS analysis courtesy of Pawan Gupta/USRA/NASA. Story by Kasha Patel with image interpretation from Hiren Jethva, Rob Levy, and Ralph Kahn.
Saturday, April 18, 2020
Weather Knowledge - 2:
(From Weather flow)
Notice how this wind circulation is largely cut off from the overall flow of upper-level wind circulating from W. to E. around the world.
Once such an air mass is cut off from the overall circulation it tends to linger in place for several days until it is again caught up in the upper-level wind pattern. Hence the term Cut-Off Low for this type of airmass.
Often a Cut-Off Low will induce a counter-clockwise spinning surface low at the surface.
You can see this happening in the second image. Due to the presence of Northern California and the coast range, the low pressure looks more like an elongated eddy running parallel to the coast.
We’ve all seen virga, but maybe not known what it’s called. Virga is rain that evaporates before it hits the ground.
Virga often appears in streaks or shafts extending from the bottoms of clouds. You often see virga over a desert, where low humidity and high temperatures can cause rain to evaporate shortly after being released by clouds. Or you might see virga at high altitudes; in fact, the precipitation often starts out in the form of ice crystals.
It’s an especially dramatic sight at sunrise or sunset.
The photos on this page are from EarthSky friends.
Pic By Mike Lewinsky
Venus and waning crescent moon at dawn on June 1, 2019 over the Sangre de Cristo mountains near Taos. There is virga near the horizon, extending downward from the clouds.
Was this cloud trying to rain itself out? No rain in sight,
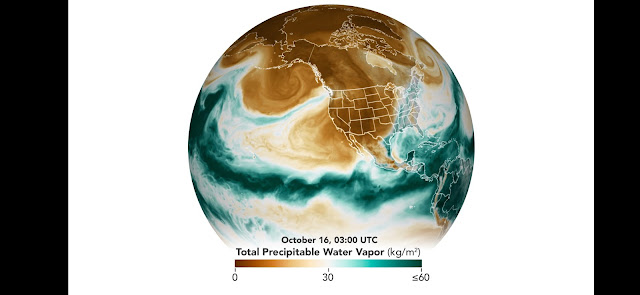


 Once we determine which of the four main cloud types is applicable, we then estimate the height of the clouds, dividing them into three main layers: low, medium and high.


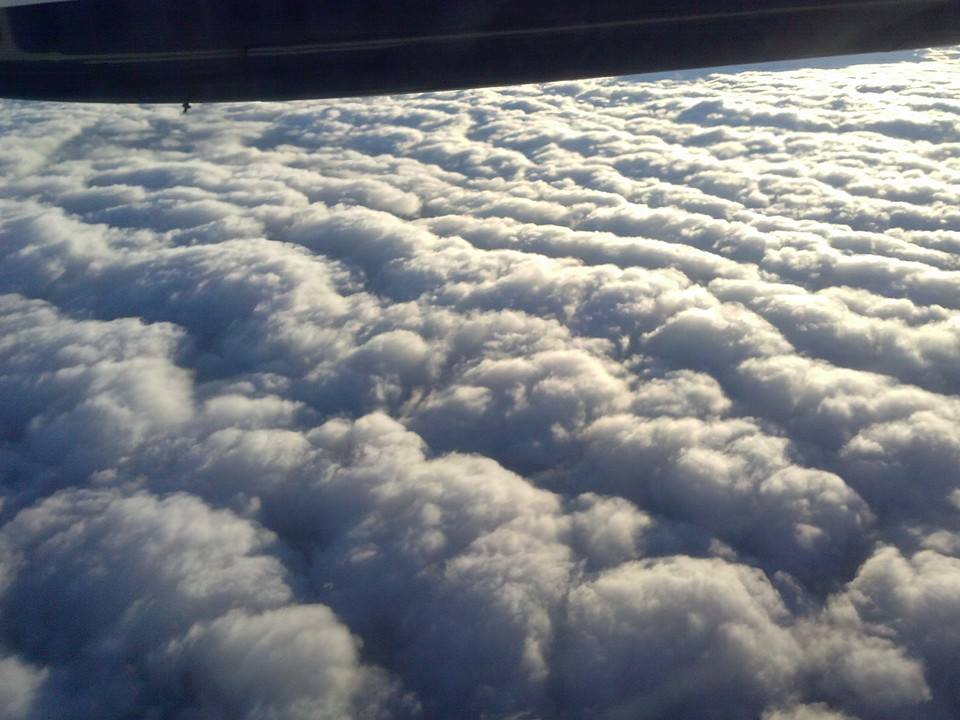 So how would this affect winds?...In the U.S. ..


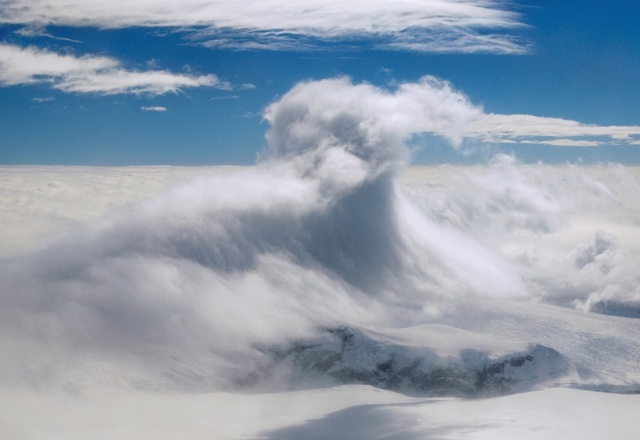


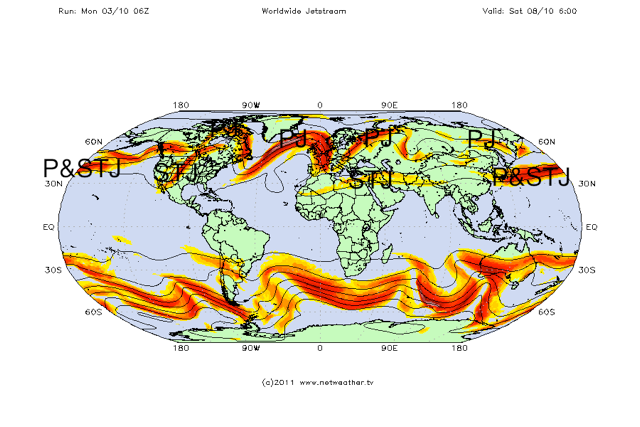
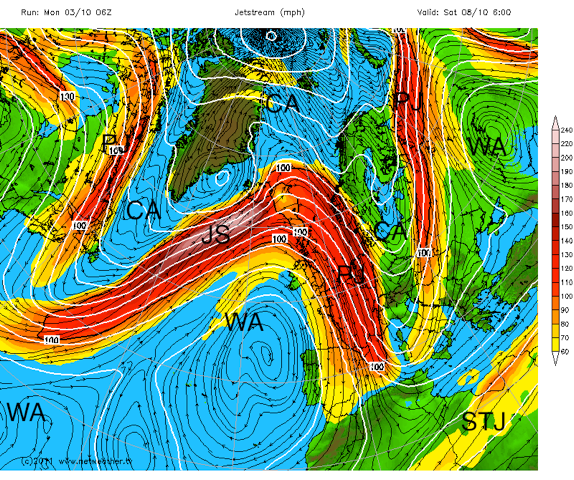
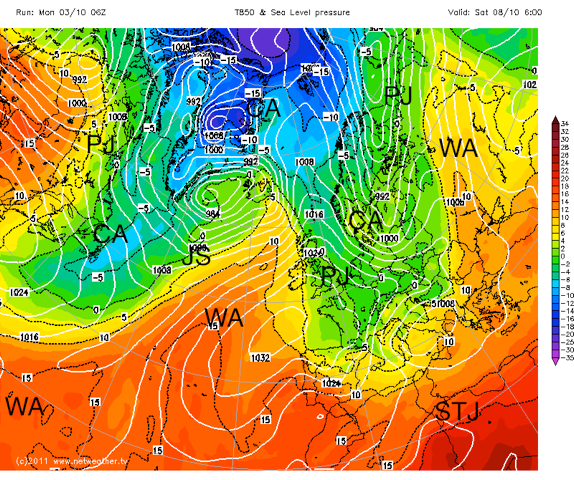
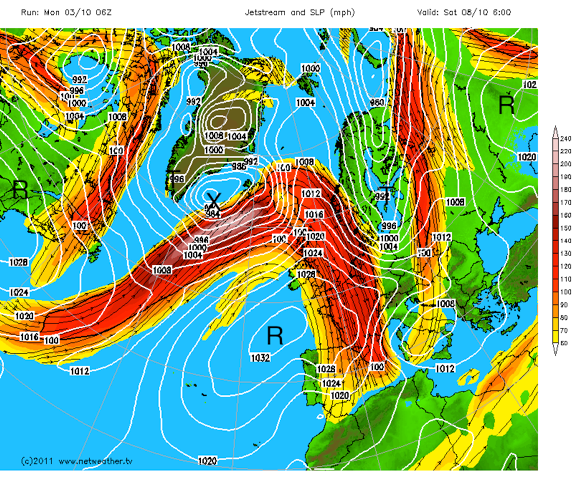

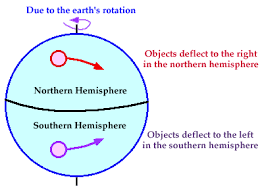


 From Cliff Mass Weather Blog
---------------------------------------------------------------------------------
From Cliff Mass Weather Blog
---------------------------------------------------------------------------------


 The word ‘cyclone’ was coined in India in 1840, thirty five years before the India Meteorological Department was established, by a man named Henry Piddington, a seafarer who became a judge who then became a meteorologist. Born in 1797, Piddington served first as a British sea captain, and was later appointed as the President of the Marine Courts of Enquiry at Calcutta (now Kolkata). Presumably, Piddington’s job would have required him to investigate cases of shipwreck and damage to ships caught in storms at sea and to settle claims. However, his interest began to wander far beyond the application of maritime law and he started examining the storms themselves.
In December 1789, a storm had struck disaster on the east coast of India, killing over 20,000 people. Piddington made a thorough investigation of this devastating storm and presented his results before the Asiatic Society of Bengal at Calcutta in 1840. In his paper, he described the storm as a ‘cyclone’, a name he had derived from the Greek word ‘kuklos’ meaning going around, or encircling, like the coil of a snake.
Piddington thereafter continued with his investigations of storms not only in the Indian seas but around ocean basins all over the world. By 1848, he had done such extensive research that he published a book with this long title: “The Sailor’s Horn-Book for the Law of Storms: Being a Practical Exposition of the Theory of the Law of Storms, and Its Uses to Mariners of All Classes in All Parts of the World, Shewn by Transparent Storm Cards and Useful Lessons”.
In the year 1840, when there was no official meteorological agency in India, when so little was known about the atmospheric and oceanic processes, when there were no weather radars and satellites, Piddington could perceive that a cyclone would look like a coil of a snake if seen from the sky above. He explained in his book how he arrived at this new word ‘cyclone’:
“I am not altogether averse to new names, but I well know how sailors, and indeed many landsmen, dislike them; I suggest, however, that we might perhaps for all this last class of circular or highly curved winds, adopt the term ‘Cyclone’ from the Greek ‘kuklos’ (which signifies amongst other things the coil of a snake) as neither affirming the circle to be a true one, though the circuit may be complete, yet expressing sufficiently the tendency to circular motion in these meteors. We should by the use of it be able to speak without confounding names which may express either straight or circular winds – such as ‘gale, storm, hurricane,’ &c. – with those which are more frequently used to designate merely their strength. This is what leads to confusion, for we say of, and we the authors ourselves write about, ships and places in the same ‘storm’ having ‘the storm commencing’, ‘the gale increasing’, ‘the hurricane passing over’ and the like; merely because the ships or localities of which we speak had the wind of different degrees of strength, though the whole were experiencing parts of the same circular storm. ‘Cycloidal’ is a known word, but it expresses relation to a defined geometrical curve and one not approaching our usual views, which are those of something nearly, though not perfectly, circular. Now if we used a single word and said ‘the cyclone commenced, increased, passed over, &c.’, we shall get rid of all this ambiguity, and use the same word to express the same thing in all cases; and this without any relation.”
We got the first glimpse of a cyclone from outer space in 1960. Since then, we have become very familiar with how a tropical cyclone looks like from space, Television news channels often present animated sequences of the images that clearly show the cloud bands swirling around the centre or the eye of the cyclone, like the coil of a snake. What Piddington could only have imagined, we are actually seeing today.
Today, however, tropical cyclones are called by this original name only in India and the adjoining seas, Arabian Sea, Bay of Bengal, and the Indian Ocean. Over the Atlantic Ocean, they are known as hurricanes, and over the Pacific as typhoons.
Henry Piddington, the captain-turned-judge-turned-meteorologist, was also engaged in scientific research in varied disciplines like botany, geology, mineralogy and soil chemistry. He published numerous papers in the Journal of the Asiatic Society of Bengal and compiled the ‘English Index to the Plants of India’. He died at Calcutta in 1858.
The word ‘cyclone’ was coined in India in 1840, thirty five years before the India Meteorological Department was established, by a man named Henry Piddington, a seafarer who became a judge who then became a meteorologist. Born in 1797, Piddington served first as a British sea captain, and was later appointed as the President of the Marine Courts of Enquiry at Calcutta (now Kolkata). Presumably, Piddington’s job would have required him to investigate cases of shipwreck and damage to ships caught in storms at sea and to settle claims. However, his interest began to wander far beyond the application of maritime law and he started examining the storms themselves.
In December 1789, a storm had struck disaster on the east coast of India, killing over 20,000 people. Piddington made a thorough investigation of this devastating storm and presented his results before the Asiatic Society of Bengal at Calcutta in 1840. In his paper, he described the storm as a ‘cyclone’, a name he had derived from the Greek word ‘kuklos’ meaning going around, or encircling, like the coil of a snake.
Piddington thereafter continued with his investigations of storms not only in the Indian seas but around ocean basins all over the world. By 1848, he had done such extensive research that he published a book with this long title: “The Sailor’s Horn-Book for the Law of Storms: Being a Practical Exposition of the Theory of the Law of Storms, and Its Uses to Mariners of All Classes in All Parts of the World, Shewn by Transparent Storm Cards and Useful Lessons”.
In the year 1840, when there was no official meteorological agency in India, when so little was known about the atmospheric and oceanic processes, when there were no weather radars and satellites, Piddington could perceive that a cyclone would look like a coil of a snake if seen from the sky above. He explained in his book how he arrived at this new word ‘cyclone’:
“I am not altogether averse to new names, but I well know how sailors, and indeed many landsmen, dislike them; I suggest, however, that we might perhaps for all this last class of circular or highly curved winds, adopt the term ‘Cyclone’ from the Greek ‘kuklos’ (which signifies amongst other things the coil of a snake) as neither affirming the circle to be a true one, though the circuit may be complete, yet expressing sufficiently the tendency to circular motion in these meteors. We should by the use of it be able to speak without confounding names which may express either straight or circular winds – such as ‘gale, storm, hurricane,’ &c. – with those which are more frequently used to designate merely their strength. This is what leads to confusion, for we say of, and we the authors ourselves write about, ships and places in the same ‘storm’ having ‘the storm commencing’, ‘the gale increasing’, ‘the hurricane passing over’ and the like; merely because the ships or localities of which we speak had the wind of different degrees of strength, though the whole were experiencing parts of the same circular storm. ‘Cycloidal’ is a known word, but it expresses relation to a defined geometrical curve and one not approaching our usual views, which are those of something nearly, though not perfectly, circular. Now if we used a single word and said ‘the cyclone commenced, increased, passed over, &c.’, we shall get rid of all this ambiguity, and use the same word to express the same thing in all cases; and this without any relation.”
We got the first glimpse of a cyclone from outer space in 1960. Since then, we have become very familiar with how a tropical cyclone looks like from space, Television news channels often present animated sequences of the images that clearly show the cloud bands swirling around the centre or the eye of the cyclone, like the coil of a snake. What Piddington could only have imagined, we are actually seeing today.
Today, however, tropical cyclones are called by this original name only in India and the adjoining seas, Arabian Sea, Bay of Bengal, and the Indian Ocean. Over the Atlantic Ocean, they are known as hurricanes, and over the Pacific as typhoons.
Henry Piddington, the captain-turned-judge-turned-meteorologist, was also engaged in scientific research in varied disciplines like botany, geology, mineralogy and soil chemistry. He published numerous papers in the Journal of the Asiatic Society of Bengal and compiled the ‘English Index to the Plants of India’. He died at Calcutta in 1858.


 Pic By Mike Lewinsky


No comments:
Post a Comment