This page is totally devoted to Vagarian Vineet..and his research.
Dr. Vineet Kumar Singh is a research scientist at Typhoon Research Center, Jeju National University, South Korea with a Ph.D. from the Indian Institute of Tropical Meteorology, Pune. His expertise is on cyclone and monsoon research.
On this page, you will get updated information on the trending research in the field of atmospheric and ocean science, along with updates on extreme weather events in India and global cyclone activity.
Role of subtropical Rossby waves in governing the track
of cyclones in the Bay of Bengal
Vineet Kumar Singh1,2 Mathew Koll Roxy1 Medha Deshpande
Pune Shivajinagar rain this monsoon season: 446.2mm, which is 26% below normal.
Most rainy month of the season: September.
Highest 24hrs rainfall was 37.9mm on 27 September

No. of rainy days in monsoon (1 June-30 September)
2023: 44 days
2022:48 days
2021:42 days
Monsoon rain (1 June-30 September) yearwise
2023:446.2mm
2022:817.4mm
2021:469.7mm
Data: IMD
Delhi rain performance Monsoon 2023
Delhi Safdarjung recorded 660.8mm rain this monsoon season, out of this 70% of rain occurred in just 7 days.
For the 1st time in last 13years, both August and September simultaneously recorded less than 100mm rain.
Below Graph shows daily rain variation in Delhi this season. Data IMD
 Number of days with rain greater 100 mm = 2 daysNumber of Rainy days in June = 8 daysNumber of Rainy days in July = 10 daysNumber of Rainy days in August = 3 daysNumber of Rainy days in September = 5 days
Delhi Safdarjung recorded 660.8mm rain this monsoon season, out of this 70% of rain occurred in just 7 days.
For the 1st time in last 13years, both August and September simultaneously recorded less than 100mm rain.
Below Graph shows daily rain variation in Delhi this season. Data IMD

9 October 2023
Record-breaking global SSTs in September 2023
Globally, September 2023 recorded the highest SST anomalies, breaking all previous records. SSTs were 0.6c above normal.
The attached graph shows the global September SST anomalies for the period 1900-2023. Source: NOAA

31 August 2023
Mahabaleshwar rain 1 June - 31 August 2023

Pune rain 1 June - 31 August 2023

Delhi rain 1 June - 31 August 2023

Number of rain days in June = 8
Number of rainy days in July = 10
Number of rainy days in August = 4
Highest 24hrs rain in August 2023: 53.8mm on 5 August
Number of days with 24hrs rain more than 10mm in August 2023 = 3 days
This is the 2nd driest August for Delhi since 2009. Also, for the 2nd year in a row, Delhi August rain is less than 100 mm.
Top 4 strongest typhoons in West Pacific in 2023 till date
1. Mawar (June): 160 knots
2. Saola (August): 135 knots
3. Doksuri (July): 130 knots
4. Khanun (July): 120 knots
30 August 2023
Idalia is now a category 2 hurricane in the North Atlantic, so now we have two simultaneous category 2+ hurricanes in the North Atlantic. The last time when North Atlantic had 2 simultaneous Category 2+ hurricanes in August was in 1999.
29 August 2023
Franklin and Idalia are both at hurricane strength. The last time that the Atlantic had 2 or more hurricanes simultaneously in August was in 2010 (Danielle and Earl).
No. of hurricanes so far in North Atlantic = 3 (climatology is 2.3)
Accumulated cyclone energy = 35.7 (climatology is 32.2)
No. of major hurricanes so far = 1
No. of hurricane days = 3.75 (climatology is 6.4)
28 August 2023
First major Hurricane of the season in North Atlantic
First major hurricane (winds >= 100 knots) of the season has formed in north Atlantic today.
Name: Franklin
Wind speed = 130 knots attained on 29 August 2023.
This is the strongest hurricane of the season in the north Atlantic.
27 August 2023
Delhi rainfall (1 June-27 August 2023)

Number of rain days in June = 8
Number of rainy days in July = 10
Number of rainy days in August (1-27 August) = 4
Rainfall in Delhi Safdarjung in August from 2009-2023
2009: 216.6 mm
2010: 455.1 mm
2011: 190.3 mm
2012: 378.8mm
2013: 321.4mm
2014: 139.1mm
2015: 195.4mm
2016: 122.1 mm
2017: 152.2 mm
2018: 206.5 mm
2019: 119.6 mm
2020: 237.0 mm
2021: 214.5 mm
2022: 41.6 mm
2023: 91.8 mm (till 27 August)
Cyclone Biparjoy: Category 3 cyclone
As per JTWC, Cyclone Biparjoy has again intensified rapidly (2nd in its lifetime) from category 1 (65knots) to category 3 (105 knots) cyclone in the last 24hrs that is an increase in wind speed by 40knots. It attained a peak wind speed of 105 knots.
This is jointly the 2nd strongest cyclone in the Arabian Sea, having its genesis in June.
Also, this is the strongest Arabian Sea cyclone (including all months) after Cyclone Tauktae.
This is the 8th category 3 or higher intensity cyclone in the pre-monsoon season in the Arabian Sea since 1980, out of which 7 have been since 2001.
Cyclone Biparjoy: Category 1 cyclone
Cyclone Biparjoy has undergone rapid intensified and intensified by 45 knots between 6 June 00UTC-7 June 00UTC. This is jointly the 2nd most intense rapid intensification by a north Indian Ocean cyclone having its genesis in June.
As per IMD, it has undergone rapid intensification and intensified by 30 knots from depression to severe cyclone in the above-mentioned period.
Cyclone Biparjoy, with a windspeed of 80 knots (as per JTWC) is now the 4th strongest cyclone in the north Indian Ocean, having its genesis in June. Also, this has surpassed the average maximum wind speed of a pre-monsoon season Arabian Sea cyclone for the period (2000-2019). The average is 75 knots.
Most of the rainfall in Cyclone Biparjoy is occurring in downhsear left quadrant of cyclone that is in the west-southwest quadrant of cyclone.

The cloud height in the outer bands of Cyclone Biparjoy are crossing 20 km height.
Cyclone in the Arabian Sea, name: Biparjoy
6 June 2023
As per IMD, cyclone Biporjoy formed in the Arabian Sea on 6 June 2023. This is the second cyclone of the year in the north Indian Ocean and the first in the Arabian Sea.
This is the 11th cyclone to form in the Arabian Sea in June since 1982 as per IMD and the 14th cyclone as per JTWC. Also, this is the first cyclone in June in the Arabian Sea after 2020 as per IMD data.
Based on JTWC data, as on 6 June 15 UTC, the wind speed of cyclone Biporjoy is 55 knots.
List of years with cyclones in June and their maximum wind speed in the Arabian Sea based on JTWC data.
1. 1987: 50 knots
2. 1988: 35 knots
3. 1989: 35 knots
4. 1992: 35 knots
5. 1994: 45 knots
6. 1996: 40 knots and 65 knots (2 cyclones)
7. 1998: 105 knots
8. 2007: 145 knots
9. 2011: 35 knots
10. 2014: 55 knots
11. 2015: 55 knots
12. 2016: 40 knots
13. 2019: 100 knots
Cyclone Mocha Update
12 May 2023


Rapid intensification of Cyclone Mocha: Latest JTWC analysis shows that Cyclone Mocha has reached a wind speed of 65 knots (Category 1 cyclone) on 12 May 00 UTC, it has intensified by 30 knots in the last 24hrs.
Latest JTWC forecast indicates that Cyclone Mocha is likely to reach a peak windspeed of 120 knots (Category 4 cyclone).
IMD-HWRF Rainfall Forecast for Cyclone Mocha
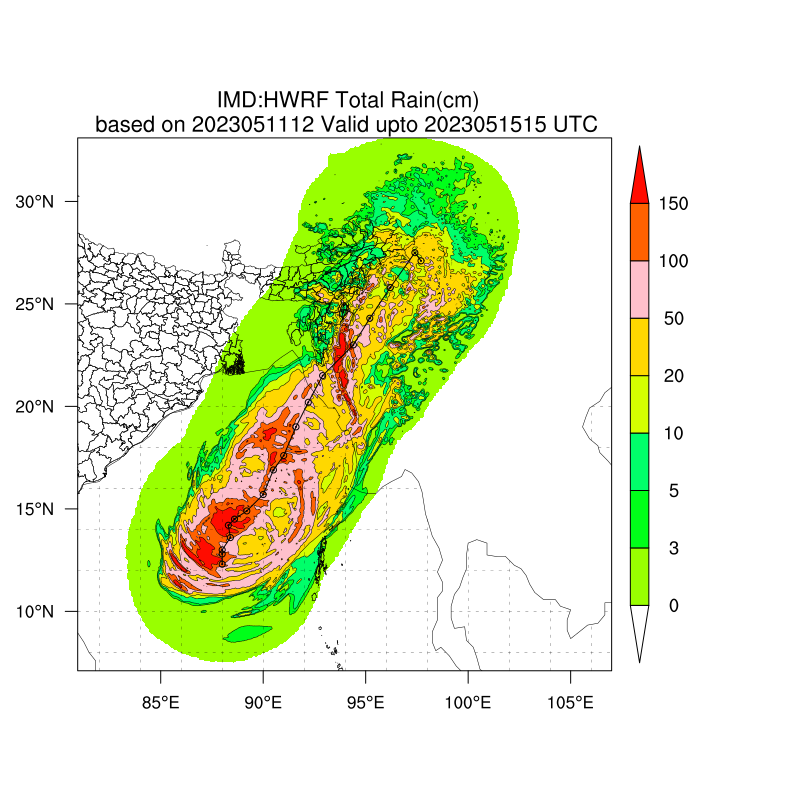
26 April 2023
Unbated record warm SSTs across the globe from over a month
Global SST (60S-60N) continue to run at record values for over a month now.
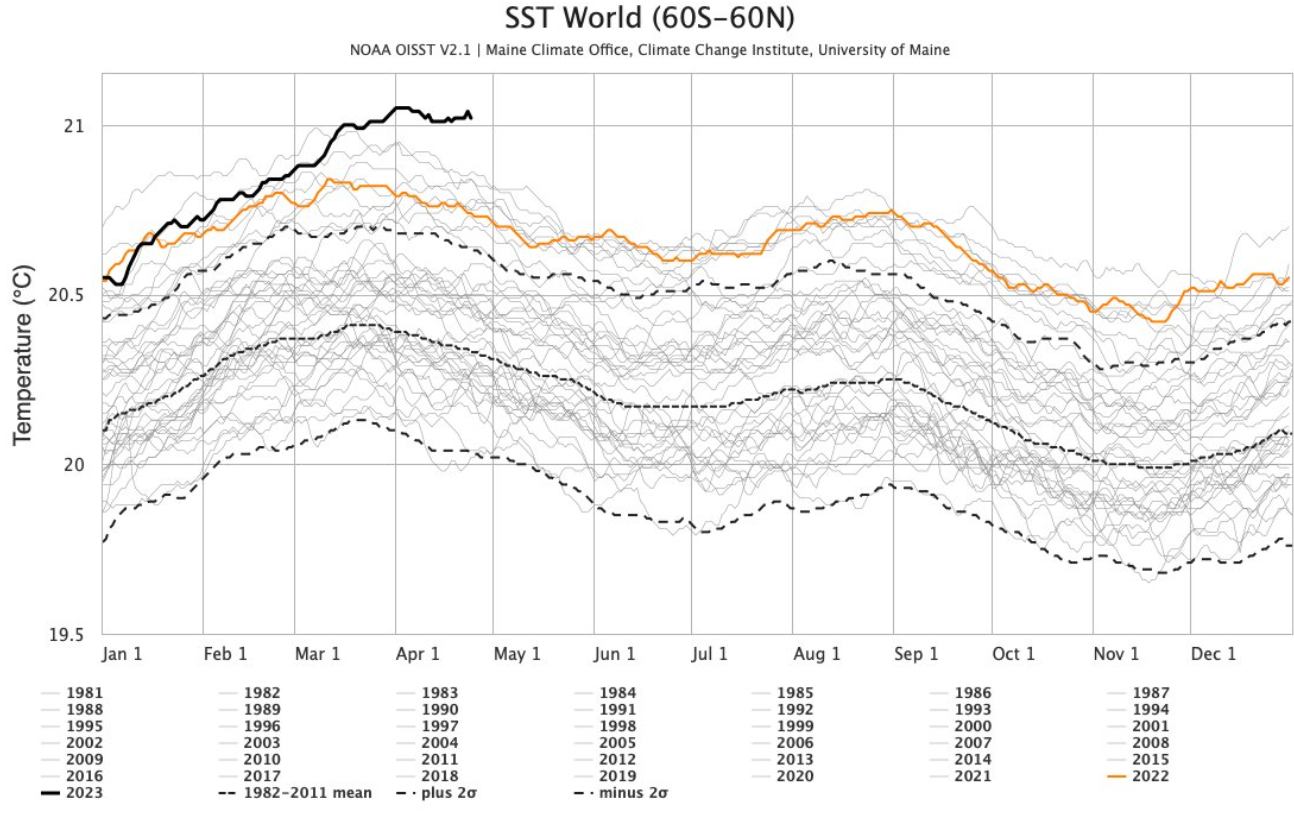
3 April 2023
Record warm SSTs across the globe

Global SST (60S-60N) are now running above 21C for the first time in the satellite era (since 1982). Data: OISST
18 March 2023
How unusual are March rains?
Attached graph shows all India average rain from 1901-2019. On avg. India get 28.33 mm rain in March. The all India March rainfall si showing a nonsignificant increasing trend of 0.3mm/decade.
This March, India got 6.4mm so far which is 60% below normal. Thus ongoing March rain in India are normal (in fact below normal so far) & nothing to do with climate change. Data:IMD

16 march 2023
For the first time after 1997, the global sea-surface temperature (averaged from 60S - 60N) reaches 21.0°C on March 15, 2023, and is tied with March 6 and 7, 1997 as the highest ever–since records began in 1981. Data: NOAA OISST
.png)
12 March 2023
Record MJO activity in phase 7-8
The MJO has amplified into the Pacific and is moving towards the Americas. This is one of the strongest pulses on record (third highest) into phases 7/8 of the RMM plot (corresponding to the Eastern Pacific), lagging just behind the 2015 event, which triggered a super Niño for now.
.png)
.png)
.png)
For the first time in recorded history, RMM1 of MJO crossed -4.0.
Cyclone Kevin in South Pacific Ocean
4 March 2023
Cyclone Kevin is the first category 4 cyclone of the season in the south Pacific with a maximum wind speed of 135 knots.
Cyclone Freddy in the south Indian Ocean
14 March 2023
Cyclone Freddy has been active for 37 days. It is the longest-lasting cyclone ever globally (since the satellite era).
Top 4 long-lasting cyclones are
1. Freddy (2023): 37 days
2. John (1994): 31 days
3. Leon-Eline (2000): 29 days
4. Ginger (1971): 27.75 days
12 March 2023
Cyclone Freddy has undergone 7 rapid intensifications during its lifetime; this is the highest frequency of rapid intensification by a single cyclone globally till date.
12 March 2023
The accumulated cyclone energy of Cyclone Freddy is 87.0. This is the second-highest accumulated cyclone energy by any cyclone on earth till date. Also, this is the highest accumulated cyclone energy generated by a cyclone in the south Indian Ocean.
Top 10 highest ACE-producing cyclones globally till March 2023
1. Freddy (2023): 87.0 (South Indian Ocean)
2. Ioke (2006): 85.6 (East Pacific, West Pacific)
3. John (1994): 70.6 (East Pacific, West Pacific)
4. Ivan (2004): 70.4 (North Atlantic)
5. Paka (1997): 70.2 (West Pacific)
6. Irma (2017): 64.9 (North Atlantic)
7. Isabel (2003): 63.3 (North Atlantic)
8. Rita (1972): 62.9 (West Pacific)
9. Fico (1978): 62.8 (East Pacific)
10. Fengshen (2002): 61.2 (West Pacific)
Cyclone Freddy most number of hurricane days after 1978
Cyclone Freddy has now produced 18.25 hurricane days (e.g., max sustained winds >=64 kt). That's the most hurricane days by a single hurricane/typhoon/cyclone globally since Fico (1978-eastern North Pacific).
The most #hurricane days on record for a North Atlantic storm is Ginger (1971). Ginger was a hurricane for a whopping 19 days and 12 hours.
Cyclone Freddy crossed the entire south Indian Ocean; this is only the fourth cyclone in recorded history to cross the entire south Indian Ocean.

15 March 2023


No comments:
Post a Comment