Vagaries© of the weather.blog written by rajesh kapadia & co-authors concentrating on meteorology of the Indian sub continent and extreme world weather since 55 years For Any Information taken from here, due credit must be given to Vagaries.
Co Authors: GSB, Shreyas Dhavale, Pradeep John, Dr. Vineet Singh, Gokul
Tuesday, February 02, 2010
This blog is to be read as a continuation of the last blog.
In the previous blog, we discussed the weather over Indian sub continent for January.
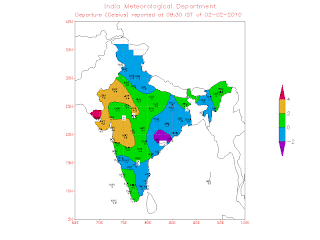
Well, now we have,above, the actual average temperature anomaly map for January. The map of the average temperature anomaly shows the northern areas, eastern half of U.P and eastern India region as below normal (due to colder foggy days). Rest, is observed in the normal range, and as expected, the west, and the west coast (Mumbai region) is above normal. What with the highest temperature in Asia being recorded in Mumbai on certain days ! We have seen the hot January diagram for Mumbai in the previous blog
And the trend continues in the first week of the current month. Todays maximum and minimum are above normal covering almost the entire country.(IMD maps).
The actual maximum temperature readings on 2nd. February are high, and shown in the map below.
And, it has also been unseasonally dry.
We now look westwards, and sight the fresh W.D. approaching the sub-continent region. Expected to precipitate fairly good amounts of rain/snow in the north, and also in the central regions of Rajasthan/M.P, the system should become active in the Indian region from Saturday. Hopefully, it should lessen the rain deficit, and bring cooler weather in its rear.
Earlier, in its path, rains are expected from this system in Dubai on Friday, and Oman on Saturday.
kapadias@gmail.com
Subscribe to:
Post Comments (Atom)
3rd February Post: Next Week warming up a bit in NW, Central and Peninsula India. Expected Temperatures Maps Image Courtesy NCMRWF Simi...

-
Short Narration: Monday 1st/Tuesday 2nd : The heaviest rains are in Madhya Maharashtra, Marathwada, North Interior Karnataka and No...
-
Much Awaited Monsoon Analysis to Date from ..None Other than Our GSB..on "Stats and Analysis" Page..Just Recieved On Saturday ...


No comments:
Post a Comment