A weak start this monsoon season with
June having an 11% deficit soon turned into an above normal July (+9%) and a
still better August (+16%), finishing with September at 11% above normal.
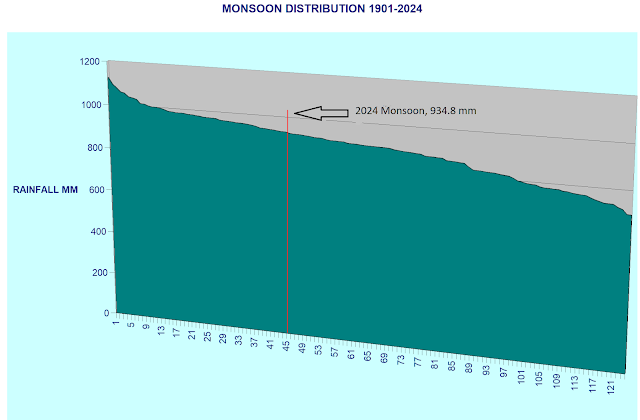
Overall the monsoon this year was almost 8% above normal. As seen in the chart below the red line shows the current year monsoon status and where it lies on the
monsoon distribution curve since 1901. A total of 44 years have seen more
rainfall than the current year since 1901.
In this century, 2013 (937.2 mm), 2007
(942 mm), 2020 (958.5 mm), 2019 (971.8 mm), were years with monsoon rainfall
higher than 2024.
X-axis represents years with monsoon
rainfall starting from highest of 1124.2mm in 1917 (extreme left) to the lowest of 697.4 mm
in 1972 (extreme right).


No comments:
Post a Comment