Posted 29th January:


-----------------------------------------------------------------------------------------------
New Find:....
Newest Cloud Types Seen in the Pacific Northwest
In March 2017, an updated International Cloud Atlas was released and several new clouds were added.
One new cloud is Asperitas, characterized by a complex wave-like base. This week (January 17th), James Dearman sent me this wonderful shot of an Asperitas cloud that he took near Vancouver, Washington (see below).
Pretty amazing cloud, with undulations looking like a sea surface turned upside down.

Here is another example from Virginia:

These clouds result from wave-like motions in the atmosphere that distort a pre-existing cloud deck. Such waves can be initiated by fronts, thunderstorms, or some other type of atmospheric disturbance. Generally no precipitation or severe weather with these clouds--but they do look scary.
Folks normally don't think about it, but the atmosphere is full of waves. Generally, the atmosphere is stable, meaning if you push an air parcel upward, it will want to return to where it started. But like a swing set, the air parcel tends to overshoot and goes into an oscillation. A pendulum is another example.

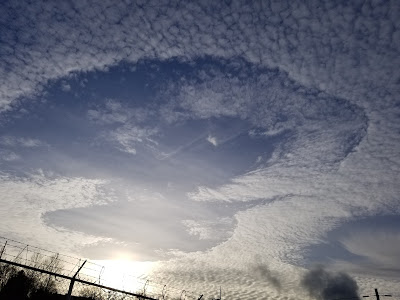
Another new cloud is one we have talked about in this blog: Cavum, or the hole punch cloud (see below). These "holes" are produced when an aircraft goes through a cloud made of supercooled water (liquid water below freezing). The passage of the aircraft through the cloud causes a transition to ice crystals, which subsequently fall out, leaving a hole.

Article Direct from Cliff Mass Weather Blog
One new cloud is Asperitas, characterized by a complex wave-like base. This week (January 17th), James Dearman sent me this wonderful shot of an Asperitas cloud that he took near Vancouver, Washington (see below).
Pretty amazing cloud, with undulations looking like a sea surface turned upside down.

Here is another example from Virginia:

These clouds result from wave-like motions in the atmosphere that distort a pre-existing cloud deck. Such waves can be initiated by fronts, thunderstorms, or some other type of atmospheric disturbance. Generally no precipitation or severe weather with these clouds--but they do look scary.
Folks normally don't think about it, but the atmosphere is full of waves. Generally, the atmosphere is stable, meaning if you push an air parcel upward, it will want to return to where it started. But like a swing set, the air parcel tends to overshoot and goes into an oscillation. A pendulum is another example.
Article Direct from Cliff Mass Weather Blog


4 comments:
Wecome New member in family of clouds :-)
Credit Australian government bureau of meteorology
Issued 30 January 2018
The latest ENSO Wrap-Up and Climate Model Summary are now available on the Bureau's website.
La Niña likely past its peak as Pacific sea surface temperatures warm
A weak La Niña continues in the Pacific Ocean, but may have peaked in recent weeks. Sea surface temperatures in the central tropical Pacific have warmed slightly since late December, with most models now forecasting that La Niña will end in the southern autumn.
Indicators of the El Niño–Southern Oscillation (ENSO) continue to reflect La Niña. Sea surface temperatures show a weak La Niña pattern, with coolest waters concentrated in the eastern Pacific Ocean. Likewise, atmospheric indicators such as trade winds and cloudiness show clear La Niña characteristics. The Southern Oscillation Index (SOI) is also at La Nina levels, though has fluctuated during the summer season due to the passage of tropical weather systems.
In order for 2017–18 to be classed as a La Niña year, thresholds need to be exceeded for at least three months. Five of eight climate models surveyed by the Bureau suggest this event is likely to last through the southern summer, and decay in the early southern autumn of 2018. With indicators hovering near thresholds since December, it remains to be seen if 2017–18 will be classed as an official La Niña year.
La Niña typically brings above average rainfall to eastern Australia during summer, particularly in northern New South Wales and Queensland. However, a weak La Niña will often have less influence on Australian rainfall compared to a strong event. La Niña events can also increase the likelihood of prolonged warm spells for southeast Australia.
The Indian Ocean Dipole (IOD) is currently neutral. IOD events are unable to form between December and April.
Next update expected on 13 February 2018
Post a Comment