Co Authors: GSB, Shreyas Dhavale, Pradeep John, Dr. Vineet Singh, Gokul
Showing posts with label Article. Show all posts

Wednesday, January 01, 2020

Year 2019 rainfall
As Nature shifts it's focus from the cold wave over the plains of North India , we shift focus on the rains of 2019 for the moment  ..

A) Highest 2019 Yearly Rains  .. 

At the western ghats (Sahyadris) of Maharashtra ..

10,790 mms (Lamaj , Maharashtra)*Jun - Sep 2019
9872 mms (Patharpunj , Maharashtra)

9865 mms (Cherrapunji , Meghalaya)

At other stations in India ..

Upto 9000 mms have recorded in the Western ghats of Karnataka..
Upto 6000 mms have been recorded at Goa..
Upto 5000 mms have been recorded in the Duars of sub Himalayan Bengal and the western ghats of Tamilnadu..
More than 4000 mms in the Western ghats of Gujarat..
Upto 3000 mms have been recorded in the Eastern ghats (Andhra, Orissa, Chattisgarh) and Satpura hills of Maharashtra..

For SWM 2019  state rainfall toppers click ..
http://www.vagaries.in/2019/10/monsoon-2019.html


B) Mumbai region..the rains at the monsoon capital of the world lived upto the expectations  .. 

400 to 500 mms of rain in 24 hours (in a day) was recorded in Mumbai region on 3 occasions ..

Upto 6000 mms of rain was recorded in the plains of the Mumbai region during SWM 2019..
Matheran hill station in the Mumbai region has recorded 7784 mms ..
Almost entire Maharashtra also had a bountiful rainfall..

C) 2019 Annual Rains at some of the cities of India .. 

1) Extremely heavy rainfall :'
Badlapur(Mumbai region) 6222 mms , 
Thane city(Mumbai region) 4937 mms 

2) Very Heavy rainfall :
Panji 4172 mms , Mumbai Scz 3855 mms , 
Kochi 3590 mms 

3) Heavy rainfall :
Belgaum city 2150 mms , Agartala 2081 

4) Moderately heavy  rainfall :
Bhopal 1867 , Surat 1837,  Kolkata 1811, 
Kolhapur/Bhubaneshwar 1761 ,Jabalpur 1708 , 
Pune (Pashan)1640 , Dehradun 1629 ,
Rajkot 1607 ,Guwahati 1593 ,Shimla 1557

5) Moderate rainfall :
Chennai AP 1469 , Nasik 1436 , Indore 1371 , Nagpur 1330 ,Vijayawada 1310 , Varanasi 1227 , Patna 1188 ,Tirupathi 1090

6) Less rainfall :
Chandigarh 968 ,Bengaluru 950 ,Srinagar 924, 
Ahmadabad 906,  Hyderabad 865 ,
Delhi (Pusa Agri) 858 , Jaipur 830 , Kurnool 780

7) Very less rainfall :
Madurai 729 , Aurangabad 716 ,Amritsar 678,
Delhi SFD 546 , Jodhpur 544

Tuesday, December 10, 2019

Climate v/s Weather v/s Climate Change...10th December

Every season a powerful storm impacts our region, there tends to be  a common types of responses. If a storm brings heavy rains and damaging gale winds, some claim it is " climate change".

In the event a heat wave or other warm-weather type of event impacts the area, others claim climate change is verified.
In truth, neither of those outcomes are true, because weather events do not directly connect to climate.
So, what is weather, and how is it different than climate?
Weather
To put it in one sentence, weather is what all of us experience on a daily basis.
Weather describes the atmosphere at a specific place and time, including temperature, pressure, humidity, sunshine, rain, or cloud cover, winds, hail, snow,  flooding, blizzards, thunderstorms, heat waves, hurricanes etc.
Meteorologists use various tools to take real-time observations of these variables on a minute-to-minute basis.
One way to think of things is that weather is what you get, whereas climate is what you expect.
Climate
While weather describes the atmosphere down to the minute, climate describes the average conditions expected at a specific place at a given time.
Climate is most frequently used on a 30-year scale, averaging together weather information such as pressure, temperatures and precipitation.
This is how the average high and low temperatures are computed for each day of the year.
Weather reports and readings mention the "average temperature" for a day, or mention that the forecast for the day is either warmer or colder than average.
Climate data can help us find out which parts of the country are typically hot and humid or warm and snowy at a particular time of year. By reviewing climate averages at a specific place, we can compare current or recent weather information to the past to help us describe whether our summer was hotter or colder than normal, for example.
Conclusion
It is incorrect to say that ONE particular storm/Event is a direct result of climate change, in one way or another, because they're different.
Climate does not cause a heat wave to impact the country, or a "Cloud burst" due to "Vortex" to impact a particular place, for example. However, over time, climate normals do change.
If the temperature were to consistently climb above 35-40c on a regular basis in June, July, and August, more often than they do now in a particular region, then this would cause 30 year "average high temperature" to rise in response.
So, while climate and weather are quite different in their execution, they are directly related. 
Reference from Anthony Macari,  STORM TEAM 10


Sunday, March 31, 2019

Importance of Monsoon Forecast for India:

Indian economy is basically agriculture based, and agri business and economy depend a lot on the South West Monsoon. Agriculture contributes a major part to the GDP.
Hence, getting information and forecast of the Monsoon to the farmers and concerned departments well in advance is of prime importance. The agri industries need to plan cropping patterns and farmers need to plan purchase and storage of seeds and fertilisers.


Now, IMD issues its first SWM forecast around mid April. The April forecast indicates the likely amount of rain throughout India , on the whole, and does not detail its distribution region wise. 
A forecast of regional distribution is necessary for water management and reservoir capacity storage. 
The second forecast and rain estimate is issued in June. By that time, sowing is already complete, and an adverse situation could be disastrous. Saving water stressed seedlings becomes a priority with urgent irrigation. One Fourth of the SWM is over by then.


Vagaries' Views:

The SWM forecast should be issued earliest by beginning April. It could be made by analysing the weather parameters developing as on that date in early April, and subsequently monitor the developments as they happen and issue comments on how the monsoon is likely to progress.  The  Monsoon Watch series in Vagaries begins with this concept..and charting the progress periodically, the Monsoon Watch Series indicates the +ves and the -ves in the ensuing progress. 
Initially Vagaries (MW Series) forecasts only the arrival date. And that is of prime importance. A belated advance could be fore warned, and help the farmer in delaying the sowing and saving his crops. Or later in the season, a prolonged withdrawal could be bad for the crops too, and should be forecasted and informed early. 


The quantum is taken up later on.
Though a proper estimate of quantum of rain and regional distribution must be estimated. If, for example, we have 120% of the normal precipitation, that is 20% excess, in say the western state of Gujarat, and say, 80% normal, or 20% deficient in another state, IMD would declare a "normal" monsoon. That is because it takes the figures from the country as a whole. This, I feel depicts a wrong picture.

The most dangerous, or risky, is the " break Monsoon" in the middle of the season. This has to be estimated and informed as correctly as possible, as it holds the key to proper crop and water planning.
In such cases the agriculture ministry must be prepared to support proper irrigation and supply in July or August.
For such fore warnings, the IMD issues a forecasted estimate by the time the Monsoon is half over.

Now, recently,The Japanese Agency for Marine Earth Science and Tech. has forecast below normal rains for Jun/July /Aug 2019, and another International Research Institute IRI at Columbia, have forecasted a near normal SWM for 2019. 

Whether true or false, our Met Department should take note of this seriously, and be prepared with the necessary steps to be taken. We just cannot wait till the IMD issues its "vague" forecasts. 


IMD maintains that it (SWM) cannot be forecasted so early, and that the Indian Monsoon system is too complicated. But let us understand, these foreign agencies also have a track record.


We cannot take risks with such an important event (SWM). An event that makes or breaks Indian Agriculture and Economy.

Wednesday, February 20, 2019

Posted Wednesday 20th February 2019


The Ozone Hole: 

Closing the Gap

 Every day, as the Sun shines on the Earth, it sends ultraviolet rays that can cause sunburn and sometimes damage our DNA. Like a sunscreen for our planet, the ozone layer absorbs most of this harmful radiation and protects us. 
But in the early 1980s, scientists discovered that the ozone layer was thinning over Antarctica each August and September. 
In 1987, nations around the world came together to fix the problem through the Montreal Protocol. The international treaty banned the production of ozone-depleting chemicals like chloroflurocarbons or CFCs. But these chemicals had been in use for decades, and they stay in the atmosphere for a long time so it took a while to see the effects of the ban. 
In 2000, the ozone hole was the largest ever observed by scientists. 
But conditions slowly improved. Data from NASA and several partners showed a 20 percent decrease in ozone depletion during August/September from 2005 to 2016.

In 2017, the hole was the smallest since 1988. A year later, the hole was smaller than expected. Studies suggest that the ozone layer over Antarctica should mostly recover by the middle of the 21st century.
NASA Earth Observatory

See Video: https://youtu.be/6BUT16jfoKk

Tuesday, January 29, 2019

Posted Tuesday Afternoon:  See Article Below

J-5 approaching from Tomorrow as mentioned...

Minimum Temperatures recorded on Tuesday 29th  Morning:
Rajasthan:
Churu -1.1c, Mt Abu 0.0c and Udaipur 2.8c, Pilani  2.5c.

Jammu and Kashmir:
Leh  -17c, Pahalgam  -14c, Gulamarg  -12c, Srinagar  -5.4c.

Himachal:
Keylong  -16c, Kalpa  -9c, Manali  -5.8c,   Kullu -1c,  Shimla  0.8c.

Punjab: Jalandhar & Kapurthala  1.0c, Amritsar 1.5c, 

Delhi Palam 5.1c, Sjung 5.4c.

Maharashtra  
Nagpur 6.5c, Nasik  7.0c, Ahmedngar 7.2c, Aurangabad 7.9c, 

M.P. 
Satna 0.8c, Umeria 2.3c , Panchmarhi 3.0c, Betul & Gwalior 3.8c, 


Article:


Inverse Hockey-Stick: climate related death risk for an individuals down 99% since 1920


Fewer and fewer people die from climate-related natural disasters.
This is clearly opposite of what you normally hear, but that is because we’re often just being told of one disaster after another – telling us how *many* events are happening. The number of reported events is increasing, but that is mainly due to better reporting, lower thresholds and better accessibility (the CNN effect). For instance, for Denmark, the database only shows events starting from 1976.
Instead, look at the number of dead per year, which is much harder to fudge. Given that these numbers fluctuate enormously from year to year (especially in the past, with huge droughts and floods in China), they are here presented as averages of each decade (1920-29, 1930-39 etc, with last decade as 2010-18). The data is from the most respected global database, the International Disaster Database. There is some uncertainty about complete reporting from early decades, which is why this graph starts in 1920, and if anything this uncertainty means the graph *underestimates* the reduction in deaths. 
Notice, this does *not* mean that there is no global warming or that possibly a climate signal could eventually lead to further deaths. Instead, it shows that our increased wealth and adaptive capacity has vastly outdone any negative impact from climate when it comes to human climate vulnerability.
Notice that the reduction in absolute deaths has happened while the global population has increased four-fold. The individual risk of dying from climate-related disasters has declined by 98.9%. Last year, fewer people died in climate disasters than at any point in the last three decades (1986 was a similarly fortunate year).
Somewhat surprisingly, while climate-related deaths have been declining strongly for 70 years, non-climate deaths have not seen a similar decline, and should probably get more of our attention.

For more Articles See Author's Page

Monday, August 20, 2018

A flood of the Century...See here

Kerala Floods and Heavy Rains August 2018....A Meteorological Explanation

Every year, the south-west monsoon gives heavy to very heavy rainfall over different parts of India spanning over the months from June-September. It has been observed that there is a significant increase in the frequency of very heavy rainfall events over the Indian landmass in the recent decades. In this year, the southwest monsoon seasonal rainfall in spite of being -7.7% below normal till 20 August, there were few episodes of very heavy rainfall in different parts of the country. This caused floods leading to huge loss of livelihood and property. The recent case was of “Kerala floods” which was triggered by very heavy rainfall during the period 14-16th August 2018. From 0300 UTC of 14th August to 0300 UTC of 15th August, the average rainfall recorded in the state of Kerala as a whole was 130 mm. Another 138 mm was recorded in the next 24 hours. This was about 10 times higher than the normal.

It has been seen that anomalous strong westerlies were prevailing at 850 hPa between 5°N - 14°N from 14th August onwards (Fig. 1a-1c). This strong westerly surge was mainly the response of the depression that had formed over the North Bay of Bengal on 14th August. Also, there was anomalous moisture transport from the Arabian Sea towards Kerala during this period (Fig. 1d-1f). This anomalous moisture was seen converging over the region which led to a rise in the specific humidity. This acted as a fuel for anomalous high convection. Further, it has been observed that from 14th August onwards strong divergence at upper levels started building up to the south-west of Kerala. This triggered the low level convergence near Kerala with values reaching up to 20 s-1. This area of strong divergence at upper levels persisted on 15th August and moved close to Kerala, leading to sustained convergence at lower levels over the region (Fig. 2a-2f). From Fig. 2g-2i it is evident that the relative vorticity also increased significantly from 14th August onwards near the Kerala coast with values reaching up to 40*10-6 s-1 on 15th August. This large positive relative vorticity along with strong convergence persisted near the coast of Kerala till the 16th of August providing favorable conditions for enhanced convection thereby leading to anomalous increase in rainfall.
During this period of heavy rain, Madden Julian Oscillation (MJO) was in phase 6. This was not conducive for enhanced convection over the North Indian Ocean. This shows that MJO doesn’t seem to have played a role in this episode of heavy rainfall over Kerala.  Thus, initial analysis suggests that this heavy rainfall maybe a response of local thermodynamical conditions along with strong westerly surge that transported large amount of moisture leading to persistent widespread heavy rainfall for 2-3 days.

Fig. 1: (a-c) Wind anomalies from 14-16th August. Color denote the magnitude of the wind anomalies. Vectors denote the direction. (d-f) Moisture flux transport (vectors) and moisture flux convergence/divergence (shading). Negative values denote convergence and positive values denote divergence.


Fig. 2: (a-c) Upper level divergence (s-1). Thick contour denotes divergence, dashed contour denotes convergence. (d-f) Low level convergence (s-1), thick contour denotes convergence, dashed contour denotes divergence. (g-i) Relative vorticity (850hPa) s-1. Color denotes the magnitude of relative vorticity with blue shades as negative relative vorticity and green - red shades denote positive relative vorticity.

 References:

3.      India Meteorological Department, Thiruvananthapuram (https://www.imdtvm.gov.in/)
4.      Tokyo Climate Center WMO Regional Climate Center in RA II (Asia) (https://ds.data.jma.go.jp/tcc/tcc/products/clisys/anim/anim_asia.html)


Monday, January 01, 2018

Wishing all Vagarians and Readers a very Happy and Successful 2018...


Let us not wriggle out of 2017 without mentioning some of the uncommon, nonseasonal, extreme and rare weather events in the world. Have tried to cover up the most, but must have missed out many..so, lets start with January....

January 2017:
2nd
The first week of 2017 brought a deadly severe weather outbreak in the Southeast USA. At least six people were killed across the Southeast on Monday as severe storms spawned strong winds, heavy rain and tornadoes.
3rd
New Year's Eve fireworks contributed to dangerously high levels of pollution in several German cities, official figures suggest. In Munich, particulate levels briefly reached 26 times the EU-recommended daily limit of 50 micrograms of particulates per cubic metre of air. National figures suggest that firework displays ejected some 4,000 tonnes of particulates into the atmosphere. That reportedly equates to 15% of yearly vehicle particulate emissions. Airborne sooty particulates are mostly emitted during the burning of fossil fuels and contribute to deaths from respiratory illnesses. The German figures have prompted environmentalists to call for restrictions on the sale of private fireworks.
4th
A thick fog settled over large parts of China, including the capital of Beijing, early in the week prompting hundreds of flight cancellations across the country. The dense fog also forced highways to be shut down with visibility being reduced to just a few hundred feet. Officials in Beijing issued a red smog alert on Wednesday, the highest possible warning level for smog, Reuters reported.
8th
The famed Pioneer Cabin tree, known for its hollow centre that allowed cars to pass through, collapsed during the intense storm that blasted California with heavy rain. The giant sequoia was located in the Calaveras Big Trees State Park in Calaveras County, about 80 miles southeast of Sacramento. The tree was a popular tourist site since the 1880s when a group of pioneers carved out the centre. It became an iconic part of the state park. Until recently, cars were allowed to drive through. Jim Allday, a park volunteer, found the collapsed tree on Sunday as a major storm affected central and northern California.
9th
More than 20 people are now known to have died as icy temperatures continue to grip much of Europe. Ten people died of cold in Poland on Sunday. The bodies of three migrants, two Iraqi and one Somali, were found near the Turkish-Bulgarian border. Deaths have been reported in Italy, the Czech Republic, Russia and Ukraine. Dozens of flights have been halted. In Turkey, the Bosphorus is closed to shipping after a snowstorm. Even Greece's islands are covered in snow. In Serbia, all river transport is suspended on the Danube. Belgrade where temperatures are currently reaching -20C". In Russia, temperatures in some regions have plunged below -40C. Normally milder Greece has witnessed temperatures of -15C in the north,

February 2017:
8th
Heavy rain has lashed parts of Fiji the past several days as a tropical low passed through the region. Rainfall has totalled more than 450 mm in Nadi causing widespread flooding and cutting off some people from their homes for several days as the Nadi and Ba Rivers overflowed their banks.
9th
Intense heat building back across Sydney, Australia, late this week should cause a 121-year-old record to fall. Temperatures are set to soar to around 38C on Friday and Saturday in Sydney with a strong area of high pressure overhead. For a city where a high of 26.5C is more common in February, this latest blast of heat will not only put a strain on residents but will also enter history books. Friday and Saturday could make for the 10th and 11th days this summer of highs exceeding 35C at Sydney's Observatory Hill (the city's official weather station). Never before have so many such days been registered in a summer since record-keeping began in 1859. The current record for the most days is nine, which was originally set during the summer of 1895-96, according to data from the Bureau of Meteorology. The record was tied this summer on 31 January as the city's hottest month on record came to a close.
13th
Following the worst drought Bolivia has seen in more than 25 years, severe thunderstorms plagued parts of central South America last week. Whilst rainfall helped alleviate drought conditions, more than 75mm of rain fell in just a few hours across parts of Santa Cruz, Bolivia.
16th
The heatwave that engulfed southeastern Australia at the end of last week has seen heat records continue to tumble like. On Saturday February 11, as New South Wales suffered through the heatwave's peak, temperatures soared to 47C in Richmond, 50km northwest of Sydney, while 87 fires raged across the state amid catastrophic fire conditions. On that day, most of NSW experienced temperatures at least 12 degC above normal for this time of year. In White Cliffs, the overnight minimum was 34.2C, a new record for the state's highest observed minimum temperature. On Friday, the average maximum temperature right across NSW hit 42.4C, beating the previous February record of 42.0C. The new record stood for all of 24 hours before it was smashed again on Saturday, as the whole state averaged 44.0C at its peak. At this time, NSW was the hottest place on Earth. And still the records continue to fall. Mungindi, on the border of NSW and Queensland, broke the Australian record of 50 days in a row above 35C, set just four years ago at Bourke Airport, with the new record now at 52 days.

March2017:
10th
Late season snow has cut off parts of northern India around the foothills of the Himalayas. The winter storms have lingered across the states of Himachal Pradesh along with  Jammu and Kashmir for much of this week. Jammu And Kashmir State was badly hit on Friday after heavy snow blocked the arterial Mughal Road, disrupting traffic movement and leaving commuters stranded.
10th-12th
A further wave of torrential rain drenched areas around Auckland, Northland and Waikato Peninsula (New Zealand) over the weekend. The heavy rain was brought by a storm system dubbed 'The Tasman Tempest' that has affected northern areas for the last week. Last week many of the same areas of the North Island recorded high levels of rainfall - some as much as 250 mm in 24 hours. Over the six day period, Whangamata recorded 475 mm of rain, which is around the same amount it would normally see for the whole of autumn. Auckland Civil Defence and Emergency Management (CDEM) said on Sunday 12 March that Titirangi recorded 65 mm of rain in just 1 hour. New Zealand's National Institute of Water and Atmospheric Research (NIWA) said that some areas saw over a month's worth of rain fall in a 24 hour period 10 to 11 March. Coromandel recorded 130 mm, Rotorua 97 mm and Auckland 91 mm. An average March rainfall ranges between 75 to 110 mm in Auckland. 

April 2017:
5th
The remnants of former Cyclone Debbie caused chaos across New Zealand on Wednesday, with floods, landslides, blackouts and more. Areas were forced to evacuate and roads were closed as the deluge battered the country, and Kaikoura was even cut off overnight. More than 100 mm of rain fell in the Kaikoura district over the 36 hours to Wednesday evening, causing a mudslide on State Highway 1, south of Kaikoura. 
6th
A 'once in 500-year' flood is swallowing up large parts of the east coast of New Zealand, as the tail-end of ex-cyclone Debbie sweeps east after devastating large parts of Australia. States of emergency have been declared in numerous regions in the North Island, after rivers burst their banks following two days of heavy rain and gale-force winds. Auckland, which received a month's worth of rain in 24 hours.
19th
A cold spell sweeping across central Europe has brought snow back to some countries including Germany, Poland and Slovakia. Most of Romania is shivering under sub-zero temperatures and winds exceeding 70 km/h, and the mountainous regions have been blanketed in snow. In eastern Ukraine, a white coat, 30 cm thick in some areas, has covered the early spring blossoms. In Kharkiv, the country's second-largest city, the weight of the snow pulled down trees and electric supply lines, leaving over a thousand homes without any power. In Switzerland too, more than 20 cm of snow has fallen in two days.
20th
Today marked the hottest April day for New Delhi since 2010. Temperatures soared to 43.2C at Safdarjung Airport and 44.9C at the Indira Gandhi International Airport. Safdarjung.
29th
Beijing had the hottest April day in at least 19 years with the temperature soaring up to 33.1C. This was the hottest day in April in Beijing since 1951, Sina News, a popular news portal in Mandarin, reported. According to the weather observatory, it was only the hottest since 27 April 1998, when 33C was reached.

May 2017:
8th
A severe thunderstorm hit Denver (Colorado) with large hail, causing damage and travel delays across the city. Roads looked as if they were covered in snow due to the amount of hail that fell. Hail as large as tennis balls was reported around Denver, smashing car windows, stripping trees of leaves and damaging some houses. 
11th
The official start of the eastern Pacific hurricane season is 15 May, but the first tropical system of the year has already formed. An area of showers and thunderstorms rapidly organized on Tuesday, becoming the earliest tropical depression and tropical storm on record in the eastern Pacific Ocean since reliable data began in 1966. The previous record for the earliest tropical depression was on May 12, 1990. This depression strengthened to Tropical Storm Alma on May 14. Strong winds high in the atmosphere have caused Adrian to since weaken back down to a tropical depression. A hostile environment may cause the storm to weaken further into the weekend.

June 2017:
1st-2nd
Two people are dead after moisture from former-Tropical Cyclone Mora led to quick-hitting torrential rainfall and major flooding in northern Taiwan on Friday. Out of the 163 mm of rain that inundated Taipei on Friday, 120 mm fell in just two hours, according to data from Taiwan's Central Weather Bureau. Flooding quickly swamped the area and turned streets into rivers, including in Taipei. Flooded tracks disrupted rail traffic. Torrential rainfall continued through Saturday as portions of the country received additional rainfall of over 600 mm. Two-day rainfall totals neared 1200 mm at Nantianchi in Taoyuan District. 
12th
An unusually strong and cold low pressure system caused several daily low temperatures and precipitation records to be set on Monday, June 12, 2017 across central and northern Nevada. On the same day, state's mountainous regions received an estimated 6 - 12 inches of snow. The rare, winter-like storm brought sharp temperature drops, heavy rain, hail, frequent lightning, and even snow. Measurable snow was recorded at Lake Tahoe in the Sierra Nevada Mountains, on the border of California and Nevada. According to NWS Reno, this is something that happens in June about every 5 to 10 years.
18th
Temperatures in Phoenix, Arizona, are likely to peak at 120F (48.8C) on Tuesday, according to the National Weather Service (NWS), which issued an excessive heat warning that will remain in effect until Thursday.  In Tucson on Saturday, daytime highs topped 105F (40.5C) for a third straight day, with 110F (43.3C) expected on Sunday and 115F (46.1C) from Monday through to Wednesday. That five-day stretch of intense heat would narrowly miss a record set in June 1994, when at least 110F was recorded on six straight days.
18th
A powerful multi-vortex tornado hit the small Russian village of Pesyanoye, just south of the city of Kurgan in the Mokrousovsky District of Kurgan Oblast. The event was accompanied by heavy rain, strong winds and large hail. According to available information, the tornado hit around 1800 h local time, almost completely destroying the village.
21st
The UK is basking in its hottest June day in 41 years, with a temperature of 34.5C (94F) recorded at Heathrow. The Met Office reading at the London airport is the highest in June since the mercury hit 35.6 (96F) in 1976 - the all-time high since records began. The heatwave has seen five days in a row during which temperatures in parts of the UK have topped 30C. 
21st
The first day of summer brought some of the worst heat the south-west US has seen in years, forcing flights to be cancelled, straining the power grid and making life miserable for workers toiling in temperatures that reached 120F or higher in some desert cities. Arizona, Nevada and California saw dramatic temperatures Tuesday as researchers say deadly heat waves like this one were going to grow more frequent. Meteorologists in Phoenix said Tuesday evening the temperature topped out at 119F, which has only been matched or surpassed four other times. The forecast called for a high of 120F - nearly 49C - in Phoenix, which the city hasn't seen in more than two decades. Death Valley, California, reached 125F and Palm Springs hit 121F, still a degree lower than the same day last year.  Phoenix has hit 120 only three times in recorded history - the last time 22 years ago. The record high was 122 degrees on 26 June 1990.

July2017:
9th
A two-hour storm unleashed 54 mm of rain on Sunday night in Paris, the equivalent of 27 days of rainfall. Weather services say 49.2 mm fell in one hour, the French capital's heaviest July deluge on record. Flooding closed 20 metro stations and three were still shut as commuters made their way to work on Monday morning. Parts of Switzerland were hit by violent winds and hail storms that also caused flooding at the weekend. Heavy rain began in Paris at 1900 GMT on Sunday night and Meteo France said the amount that fell was higher than the previous record of 47.4 mm set on 2 July 1995.
15th
When Santiago residents awoke on Saturday morning, they were greeted by an unusual sight. The Chilean capital was blanketed in a layer of snow measuring up to two inches, reportedly the heaviest snowfall the city has experienced since 2007. The frosty conditions wreaked havoc in the city where snow rarely falls.
22nd
A ferocious storm has buffeted the lower South Island of New Zealand overnight, with three states of emergency declared in Christchurch, Timaru and Otago and the city of Dunedin accessible only by air.In Christchurch and Dunedin several wastewater pumping stations were unable to keep up with the deluge and contaminated wastewater flowed onto city streets. In the last 24 hours the Metservice recorded more than 220 mm of rain on the hills north of Dunedin, 162 mm in Oamaru and 104 mm in Ashburton.
26th
Incessant rain continued to lash Gujarat on Wednesday, worsening a grim situation in the state's northern region where tens of thousands of people were marooned by one of the worst floods in recent times. Several flights were diverted from Ahmedabad on Wednesday with floods damaging parts of the runway, officials said. Gujarat and Rajasthan are reeling under massive floods, the latest states in the country to face monsoon fury in India 

August 2017:
10th
While Europe battles with a heatwave named Lucifer, the Middle East is enduring a summer so brutal that even those accustomed to Baghdad's searing August weather are labelling it 'ungodly'. As temperatures rose towards 51C on Thursday, Iraq's government declared a mandatory holiday, allowing civil servants to shelter at home. So far this month in the Iraqi capital, every day but one has reached 48C or higher, and the forecast is for the high temperatures to continue for the next week. July was little different, in Iraq and in Syria, where the capital, Damascus, has also been several degrees hotter than usual nearly every day since late June. In Kuwait, where birds have reportedly dropped from the skies, and Riyadh, where building work has ceased this week, locals have called for mercy from a hotter-than-normal air mass that has remained nearly stationary over central Arabia for more than three weeks.
29th
A plane has manoeuvred its way through three tornadoes hovering over the Black Sea, as it came in to land at a Russian airport. Reports suggest the pilot wasn't properly informed about the presence of the tornadoes, all of which were at an alarmingly close distance to one another. Up to 12 twisters were spotted in the area earlier that day. See here for images of the events.

September 2017:
1st-3rd
A heatwave shattered records and exacerbated wildfires across the western United States. The latest burst of heat brought the hottest conditions ever recorded in downtown San Francisco as the temperature to 106F on the 1st. The previous record of 103F was set on 14 June 2000. Dozens more all-time and daily record highs were set from Los Angeles to Portland, Oregon, and Missoula, Montana, over the weekend. The hot, dry conditions fanned the La Tuna Fire north of Los Angeles, which charred over 7,000 acres
5th-7th
Hurricane Irma strengthened to a Category 5 hurricane with maximum sustained winds of 185 mph on Tuesday, becoming the strongest storm in the Atlantic Basin since Wilma in 2005. Irma has already proved destructive across the northern Leeward Islands. The eye of Irma passed over the British Virgin Islands on Wednesday afternoon, devastating the islands and parts of Puerto Rico. 
8th-10th
Hurricane Irma made landfall on the Camaguey Archipelago of Cuba Friday evening, close to Playa Santa Lucia. This was the first Category 5 hurricane to make landfall in Cuba since 1924. The center of Irma then continued moving northwest along the northern coast of Cuba through early Saturday afternoon. A wind gust to 159 mph was reported at a weather station in Ciego de Avila, Cuba, early on Sunday. The Turks and Caicos Islands experienced some of the worst conditions from Irma Thursday night into Friday since the eye passed so close to the south. Extreme winds in excess of 150 mph battered the islands.
21st
More than a month's worth of rain fell across parts of Mumbai in just 24 hours from Tuesday into Wednesday. Rainfall totalling 303.7 mm was reported in the city from Tuesday to Wednesday morning, the second highest 24-hour September rainfall total on record. The all-time wettest 24-hour period in September was 318.2 mm from 12 September 1981. Mumbai averages 301 mm of rain during the entire month of September. An additional 63 mm followed from midday Wednesday to Thursday morning.
30th
Australian temperature records tumbled again in September this year, with the country experiencing the hottest day since records began, and New South Wales breaking that record twice within a few days. As always, particular weather events caused the records to be broken. On 22 September 2017 Australia experienced its hottest September day since records began more than a century ago, reaching an average maximum temperature across the continent of 33.47C - breaking the previous record set nine years ago. NSW reached a record September temperature of 35.81C on 23 September - almost 15 degC above the average September temperature and more than 1.6 degC above the record set in 2003. But in some locations, records tumbled multiple times in September. NSW recorded a September temperature above 40C for the first time in Wilcannia, setting a record measurement of 40.5C on 23 September. That record lasted just four days, with Wanaaring breaking it on 27 September, reaching 41.4C. Queensland also experienced its hottest day over the whole state on 27 September, reaching 42.5C in Birdsville, and Victoria recorded a new September temperature record, measuring 37.7C for the first time at Mildura. The average temperature for the month was not a record temperature, with that record being set by a highly unusual spring in 2013.

October 2017:
2nd
The Queensland city of Bundaberg has endured its biggest one-day downpour in more than half a century, causing flash flooding and leaving thousands without power. A Bureau of Meteorology spokeswoman said the Wide Bay city had received more than 340 mm rain on Monday, breaking a 64-year record by more than 60 mm. Residents described cyclonic-like winds which downed trees and power lines and sent debris flying.
10th
At least nine people are dead after dangerous conditions unfolded from Durban to Johannesburg, South Africa, stranding vehicles and toppling trees. One police officer of Durban was pronounced dead, when a container fell on his car on Tuesday morning, according to Times LIVE of Johannesburg.  As of Tuesday afternoon, local time, areas south of Durban, including Paddock, had more than 140 mm of rainfall from the storm.
16th
Ireland experienced the worst of the weather associated with ex-hurricane Ophelia on Monday, with winds of almost 100 mph damaging electricity networks and causing widespread disruption. 
An "unusual" reddish sky and red-looking sun were reported across many parts of England. The phenomenon was initially seen in the west of England and Wales before spreading to other areas, and was due to the remnants of Hurricane Ophelia dragging in tropical air and dust from the Sahara  along with debris from forest fires in Portugal and Spain. The particles in the air cause blue light to scatter, leaving longer-wavelength red light to shine through.
23rd-24th
At least two people were killed and many injured as a mammoth typhoon struck Japan, hurling dangerous winds and threatening to cause major flooding and mudslides. Typhoon Lan made landfall early Monday along Japan's southern coast near Minamiizu.  Several parts of Japan have already recorded rainfall totals greater than 500 mm in the past 72 hours. Shingu, a city in the Wakayama Prefecture southwest of Tokyo, recorded 894 mm of rain over the past 72 hours - their greatest rainfall total in such a period since the city received 425 mm in 2000.

November 2017:
7th
In the Indian capital, Delhi, residents woke up to a blanket of thick grey smog. Visibility is poor as pollution levels reached 30 times the World Health Organization's recommended limit in some areas. The Indian Medical Association (IMA) declared "a state of medical emergency" and urged the government to "make every possible effort to curb this menace". The levels of tiny particulate matter (known as PM 2.5) that enter deep into the lungs reached as high as 700 micrograms per cubic metre in some areas on Tuesday, data from the System of Air Quality Weather Forecasting and Research website shows. 

December 2017:
8th
A rare snow fell in parts of southern Texas late this week, including as far south as San Antonio and Houston. Houston recorded measurable snow for the first time in eight years on Friday morning. San Antonio received nearly 2 inches of snow.
11th
Heavy snow blanketing northern Europe has caused many flight cancellations and delays at Schiphol airport in the Netherlands and Brussels airport. Nearly 300 KLM flights were cancelled at Schiphol, while Brussels airport scrapped at least 50. Travellers have been advised to check flight updates at home, rather than set off for the airport in bad weather. In Germany the heavy snow has caused many car crashes and traffic jams, as well as train delays. More than 300 flights were cancelled on Sunday at Frankfurt airport, the busiest in Germany. In France 32 regions were put on an emergency footing, as snowstorms battered coastal areas and cut power to thousands of homes. About 80,000 homes lacked electricity in the Loire Valley on Monday, the daily Le Parisien reported. Snowstorms have also spread southwards to Italy, causing some travel chaos in northern regions.
20th
A man has died after collapsing during the height of Sydney's sweltering conditions before a dramatic change in weather saw a 10-degree drop in the space of just two minutes. The man, aged in his 60s, died after collapsing at Woolooware Golf Club in Sydney's south before 1pm after a round of golf as temperatures rose to more than 40C. The storm sent the mercury plunging from 37C to 24C in just 10 minutes as the cool change swept across the state. Mascot, in Sydney's south, dropped ten degrees in two minutes after their hottest day in December in 12 years. Newcastle also saw its hottest day in 12 years, peaking at 40C.

Last years Annual Events here.


-----------------------------------------------------------------------------------------------------------------------------------------------------------------------------

Wednesday, December 27, 2017

Importance of 200 jet streams...The Initial Weather maker...the King:

As any Vagarian will agree, I have always stressed the importance of the 200 mb Jet Streams....studying the Jet Streams, one can foresee a depression coming and even the track it can take later....

Depressions are one of the most significant weather systems affecting temperate latitudes. Surprisingly, and as Vagaries mentions to all its "readers/learners",  the origin of depressions is in the upper part of the troposphere even though the effects are felt at ground level. We look at the polar front's role in creating the upper westerlies and Rossby waves which set the scene for depression formation.
 Depression begins when poleward moving warm air from the tropics meets equatorward moving cold air from the poles. The cold air from the poles is dense and forms a shallow atmospheric layer. In contrast, the warm air from the tropics is more buoyant and forms a fairly deep atmospheric layer. Where these two air masses meet (the polar front), there is a strong pressure gradient between the dense cold air and the less dense warm air. 

At ground level, this pressure gradient drives winds from the polar air into the tropical air. This should create a northerly air stream, but the spin of the earth deflects winds to the right in the northern hemisphere so a polar northeasterly wind is formed instead. At the top of the troposphere (the lowest atmospheric layer where all weather forms), the pressure gradients are reversed. 
Since the polar air is cold, dense and concentrated at ground level, there is little present in the upper troposphere so an even stronger pressure gradient exists in the opposite direction. At this height - far from the frictional drag of hills and mountains - very high windspeeds can develop. The pressure difference along the polar front therefore creates a region of high speed winds known as the upper westerlies.
The upper westerlies - and their embedded jet streams - form a series of huge meanders. In it are embedded "Divergence" and "Convergence"...Divergence being the original "Source" of a System. These help to create the depressions which form such a prominent part of  weather. The meanders vary in size and location but there are certain areas where they are very common. 
Depression source areas 
We can predict certain areas will be common "breeding grounds" for depressions from the following observations: 
1.Depressions are triggered in locations where jet streams accelerate. Depressions can form slightly aligned to the core of the Jet Streams.
2.Jet streams accelerate when the Rossby wave meander heads back towards the polar regions
3. Locating and forecasting the Divergence in the Stream.
4. Checking the core region of the Jet stream for estimating the Location of the formation of a system.

This meandering wavy pattern of the jet stream in the upper troposphere are known as Rossby waves (as shown in the second part of the picture ).
IMAGE
Now, proceeding to third and fourth picture, you will realise the invasion of some points by warmer latitudes below polar region by some cold pockets which will subsequently affect the weather of the region by causing extremities in local temperature.

Also, Rossby waves creates some areas of high pressure (at ridges) and low pressure (at troughs).


The air over a huge area of sea or land rises up to join the jet stream whilst air from thousands of square kilometres either side converges uneasily along "frontal" zones. 
By contrast, areas of decelerating jet stream result in subsiding air creating high pressure at ground level (see below).


Due to the tendency of cold wind from poles to move towards equator and warm winds vice versa towards poles, they distort the path of the jet stream travelling in a straight line and cause them to move in a wave like pattern or meander at various intervals.

Forecast of Depression formation and its location can be estimated by you...just study the 200 level jet streams. Be less dependant on Weather Models. 
 End of Article..

----------------------------------------------------------------------------------------------------------------------------------------------------------------------------------------------------------------------------------------------------

Check the Latest Development in the Sub Continent Weather on Current Weather Page

Saturday, November 25, 2017

Posted 25th November:
We in the Sub Continent do not get to see this beautiful phenomena.
Those visiting the Arctic Countries saw a rare and unusual phenomena few days ago...Pink Auroras !
On Nov. 22nd, the face of the sun was unblemished by sunspots, and NOAA classified solar activity as "very low."  
Nevertheless, the skies above Tromsø, Norway, exploded with a remarkable outburst of pink auroras. "Suddenly, the whole valley turned white (with a hint of pink)," says Frank Meissner, who witnessed and photographed the display. "It was over after about 20 seconds."

How bright was it? "The brightness of the auroras may be compared to the car lights in the background of my photo," points out Meissner.

In nearby Kvaløya, aurora tour guide Marianne Bergli witnessed a surge of pink that was, if anything, even more dramatic:


This outburst was powered by a stream of solar wind flowing from a hole in the sun's atmosphere. Such holes are common during Solar Minimum, and they require no sunspots to form.
The pink color of the outburst tells us something interesting about the solar wind on Nov. 22nd: it seems to have been unusually penetrating. Most auroras are green–a verdant glow caused by energetic particles from space hitting oxygen atoms 100 km to 300 km above Earth's surface. Pink appears when the energetic particles descend lower than usual, striking nitrogen molecules at the 100 km level and below.
Article from spaceweather.com

This article will be posted in Author's Page of this blog also.

Thursday, October 26, 2017

von Kármán vortices

In 1912, physicist Theodore von Kármán, a Hungarian-American physicist, was the first to describe the physical processes that create long chains of spiral eddies like the ones shown above. Known as von Kármán vortices, the patterns can form nearly anywhere that fluid flow is disturbed by an object. “von Kármán vortices” arise when winds are diverted around a blunt, high-profile area, often an island rising from the ocean. The alternating direction of rotation in the air forms swirls in the clouds.
In this case, the unique flow occurs as winds rush past the tall peaks on the volcanic islands. As winds are diverted around these high areas, the disturbance in the flow propagates downstream in the form of vortices that alternate their direction of rotation.

 the Visible Infrared Imaging Radiometer Suite (VIIRS) on the Suomi NPP satellite captured a natural-color image (top) of such swirls on the lee side of Guadalupe Island. The volcanic island rises from the Pacific Ocean off the coast of Baja California, Mexico.


The second image shows the same phenomenon occurring an ocean basin away, on the lee side of Tristan da Cunha—a remote volcanic island in the South Atlantic. The image was captured on June 25, 2017, by the Operational Land Imager (OLI) on the Landsat 8 satellite. The image is false-color (OLI bands 6-5-3) to better distinguish areas of land, water, and clouds.

Friday, October 13, 2017

Author's Note:
Most thunderstorms occur in the late afternoon. By this time of day, the sun is beginning to set. The orange hue is caused by the same process that causes the vivid colors at sunsets. Shorter wavelengths of light (blue) are scattered quickly, leaving only the yellow-orange-red end of the spectrum.The moisture particles are so small that they can bend the light and alter its appearance to the observer. These water droplets absorb red light, making the scattered light appear blue. If this blue scattered light is set against an environment heavy in red light—during sunset for instance—and a dark gray thunderstorm cloud, the net effect can make the sky appear yellow or even faintly green.
It's a pretty reliable sign of a thunderstorm,
Now, Yellow Orange and Red are the last 3 colours of VIBGYOR. Sometimes, rarely in Mumbai, we see a greenish tint also. The next colour in the spectrum. ( I have seen it once in Mumbai many years ago).
Scott Bachmeier, a research meteorologist at the Cooperative Institute for Meteorological Satellite Studies at UW–Madison: " Particles in the air scatter light. In the day, the particles scatter more violet and blue light, but our eyes are more sensitive to blue light — that’s why the sky appears blue.
Thunderstorms, (which can be the home of tornadoes), usually happen later in the day, when the sun is approaching the horizon. That creates a reddish tinge in the sky, as any fan of sunsets knows. But light under a 12-mile high thundercloud is primarily blue, due to scattering by water droplets within the cloud. When blue objects are illuminated with red light, Bachmeier says, they appear Yellow/green.
A green cloud “will only occur if the cloud is very deep, which generally only occurs in thunderstorm clouds.” 

Also Understand: Thunderstorms are a great way for the atmosphere to release energy. When warm moist air meets colder drier air, the warm air rises, the water vapor condenses in the air, and forms a cloud. As the water vapor condenses it releases heat, which is a form of energy. A large amount of the thunderstorm's energy comes from the condensation process that forms the thunderstorm clouds. As the thunderstorm progresses, eventually the rain cools the entire process down and the energy is gone.


Saturday, August 12, 2017

Posted Saturday Evening:

With the Monsoon Axis stuck in the Himalayan Foothills, the heavy rains in G.West Bengal and Bihar have started...and Pradeep provides us the latest rain amounts
Rainfall in mm ending 8.30 am in West Bengal on 12.08.2017
-------------------
Hasimara - 478, Buxaduar - 445
Barobhisha -­ 440 , Alipurduar­ - 390, Chepan­ - 320
NH ­31 - 295 , Jalpaiguri­ - 295, Domohani­ - 250 
Diana - 230, , Coochbehar­ - 233, Murti - ­200 
Mathabhanga­ - 190, Dumka­ - 185, Neora­ - 170 
Sevoke - 150 , Gazoldoba­ - 140 , Nagrakata - 120 
Mohanpur - ­120 , Bagdogra­ - 105 , Bankura­ - 104, Malda - 102

In Assam no signs of floods coming down with Gossaigaon recording 371 mm.
Bihar too in the foothills are getting heavy rains with Bahadurganj recording 324 mm, Taibpur 315 mm and Forbesganj 295 mm.( From PJ)

Cherrapunji recorded 295.6 mm rainfall on Friday and crossed 5000 mm seasonal rainfall mark.
Seasonal rainfall: 5208 mm (Friday 11th)
Annual rainfall: 8740 mm (Friday 11th).
(From Shivkumar Mogal)

-------------------------x------------------------------------x-------------------------------x-----------------x------
New Weather Phenomena: Space Lightning:
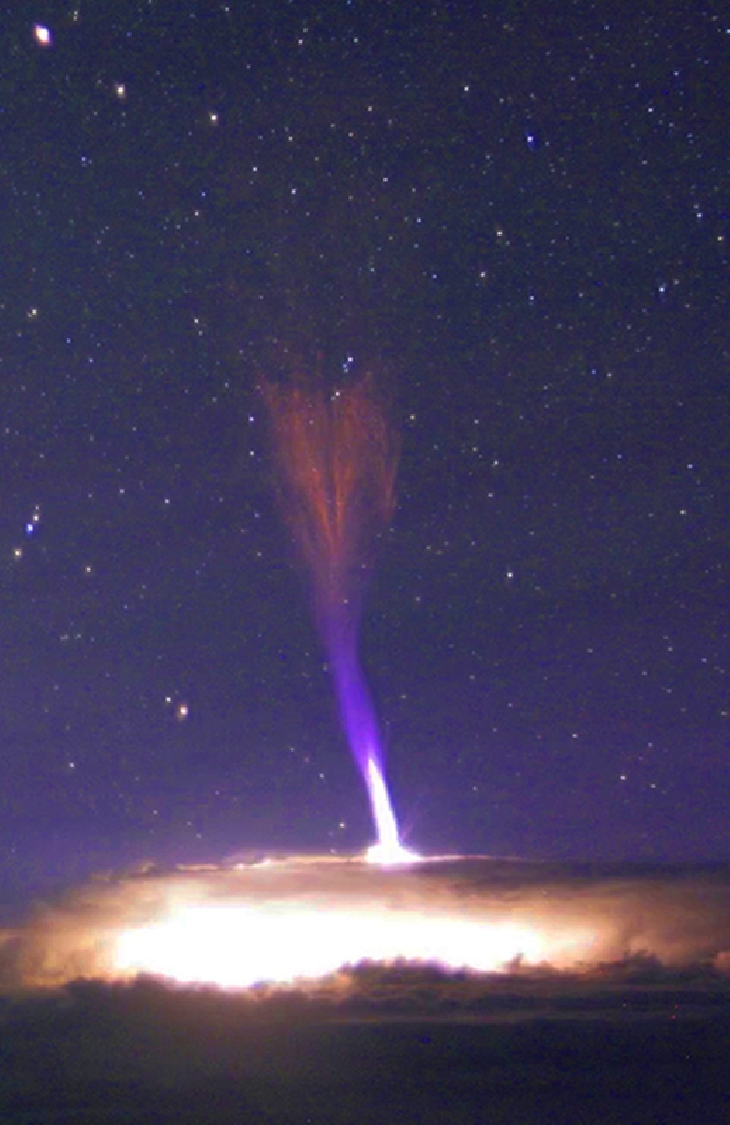
As the rest of India is comparatively silent, i take this opportunity to provide readers with this  an unusual (newly found in 2001) weather phenomena called "Space Lightning". The Gemini cloudcam atop Mauna Kea in Hawaii monitor storms approaching some of the world's largest telescopes. It often captures bright bolts of lightning lancing down to the ground This time the cameras caught lightning lancing upwards ! 
It was not until 2001-2002 that Gigantic Jets were first recorded from Puerto Rico and Taiwan." Only a few dozen Gigantic Jets have ever been seen, mostly over open ocean.
A rare footage of Gigantic Jets leaping up from a powerful thunderstorm. The strange-looking bolts reached toward the edge of space.
Cloudcam video caught at least three of these jets springing from the tops of a powerful growing thunderstorm. The tallest of them reached all the way to the ionosphere some 80 km overhead.


Sometimes called "space lightning," Gigantic Jets and their cousins the sprites are true space weather phenomena. They inhabit the upper atmosphere alongside auroras, meteors and noctilucent clouds. Some researchers believe they are linked to cosmic rays: subatomic particles from deep space striking the top of Earth's atmosphere produce secondary electrons that could, in turn, provide the spark for these upward bolts.

The link to cosmic rays is particularly interesting at this time. For the past two years, space weather balloons have observed a steady increase in deep space radiation penetrating our atmosphere. This increase is largely due to the decline in the solar cycle. Flagging solar wind pressure and weakening sunspot magnetic fields allow more cosmic rays into the inner solar system--a trend which is expected to continue for for years to come. These changes could add up to more Gigantic Jets in the future. 
Article courtesy Spaceweather.com. Excerpts from spaceweather .com. More on this here.

Akvan

 17th November  Current Intensity Analysis   UW - CIMSS ADVANCED DVORAK TECHNIQUE ...