Maharashtra RAINFALL Normals month wise
https://docs.google.com/spreadsheets/d/1Aj1_VlbhjUY4MfRU0GnGPLt-b6X_imPWco15pj0T5T8/edit?usp=drivesdk
Rainfall of Major Indian cities in June 2025
Hyderabad: 15mm
Bengaluru: 24.4mm
Srinagar: 37.5mm
Patna: 61.6mm
Amitsar: 100.9mm
Chennai : 106 mm
New Delhi S'Jung :107 mm
Raipur: 125.9mm
Bhopal: 155.9mm
Shillong: 184.2mm
Guwahati: 185.1mm
Kolkata: 198 mms
Prayagraj: 231mm
Ahmedabad: 249.6mm
Chandigarh: 262.1mm
Jaipur: 263.8mm
Imphal: 264.6mm
Shimla: 271mm
Thiruvananthapuram: 307 mms
Agartala: 391.2mm
Dehradun: 398.7mm
Mumbai santacruz: 513 mm
Panjim: 733mm
Port Blair: 754.1mm
Cherrapunji: 974 mms
Mangaluru: 1257.1mm
Rainfall Total of May 2025 (with normal in Brackets)👇
Mumbai:
Mumbai Colaba: 503 mms ( 16mms). ...Record for May beating 218 mms in 1918.
Heaviest 27th 24 hrs fall of 162 mms on 27th May broke the previous May Record of 128 mms in 2000.
Mumbai Scruz: 378 mms ( 18 mms)....Scruz record of 388 mms in 2000 hold good !
Mumbai Avg. May month Average Max in 2025 is 33.5c...Day/Night Average 30.0c...Normal Average is 30.5c
------------------------------------------------------------
2. Pune:
One of the coolest May on record for Mumbai & Pune....With coldest May Day ever for Pune at 24.8c on 27th...
2025 May Month Max Avg is 33.2c Normal is 37.3cOverall day/Night Avg: 25.9c...
May Rains Total:👇Pune: 240.2 mms ( 30 mms) Record for May beating 182 mm in 1933
Mahabaleshwar: 445 mms ( 67 mms)
Matheran : 551 mms
Guhagarh: 707 mms
Mormugao : 700 mms
Panjim: 637 mms ( 65 mms)
Dabolim : 680 mms
Mapusa: 693 mms
----Cherrapunji : 1437 mms---------------------------------------------------------------------------------------------------------------------
Compiled by Vagarian Vineet


Mumbai Heat Statistics:
February 2025: 26th touched 38.7c (+ 5.9c)...Hottest in 5 years. All Time record for February is 39.6c in 1966.
March 2025: 11th March touched 39.2c.
All Time March Record is 41.7c in 1956.
In Mumbai, days when the maximum temperature exceeds 37 degrees Celsius, or settles between 4.5 degrees Celsius to 6.4 degrees Celsius above normal, it is classified as a heatwave.A severe, or extreme heatwave, occurs when the daytime maximum temperature settles at 6.5 degrees above normal or more.
Based on an analysis of India Meteorological Department (IMD) data, the recently unveiled Mumbai Climate Action Plan (MCAP) shows that the city has experienced a total of 13 heatwaves since 1977. More than half of these (8) occurred in the last 15 years, in line with the rising annual temperatures in Mumbai. IMD data indicates that between 1973 and 2020, the city has grown warmer by 0.25 degrees Celsius each decade. Mumbai saw heatwave events in 1977, 1981, 1985, 1989, 1995, 2005, 2009, 2013, 2014 and 2018. Severe heatwaves occurred in 2004, 2011, March 2022, 2023, 2024, 2025.
Mumbai’s average annual temperature has remained consistently above normal for the last 16 years, and data shows that the city is getting hotter. Between 1973 and 1998, the annual mean temperature of the city showed an average departure from normal of +0.004 degrees Celsius per year, which rose to +0.011 degrees Celsius per year between 1999 and 2008, and then further to +0.042 degrees Celsius/year between 2009 and 2020.
Actually for Mumbai, More stress is on Urban Heat islands Effect :
“The overall air temperature trend highlights warming related to global climate change, whereas the trend of increase in late evening and night-time temperature points to a much more localized phenomenon associated with city-scale urbanization and development. The long-term trends of increasing night-time and evening temperatures correspond well with the concept of urban expansion, whereas the rise in post-monsoon and winter temperature trends point to the post-monsoon heat phenomenon,” the MCAP states, though the raw data has not been provided.
India Heat Waves


2101-2023..Heat Wave Days 👇

 Min wise record breaking morning temp (27/02/2025)Dehradun 16.7°C (New ATR)Sriganganagar 18.0°C New ATROld ATR 16.9°C (2021)Amritsar 17.4°C Matched with ATR 17.4°C (2021)Safdarjung, Delhi 19.5°COld ATR 17.2°C (2015)Ambala 18.2°C (New ATR)Rohtak 18.0°C (New ATR)
Bikaner 21.4°C (2nd ATR)Churu 19.8°C (2nd ATR)Palam, Delhi 19.1°C (2nd ATR)Chandigarh 18.5°C (2nd ATR)Hisar 18.3°C (2nd ATR)
Meerut 16.8°C (2nd ATR)
.png)

Hyderabad: 15mm
Bengaluru: 24.4mm
Srinagar: 37.5mm
Patna: 61.6mm
Amitsar: 100.9mm
Chennai : 106 mm
New Delhi S'Jung :107 mm
Raipur: 125.9mm
Bhopal: 155.9mm
Shillong: 184.2mm
Guwahati: 185.1mm
Kolkata: 198 mms
Prayagraj: 231mm
Ahmedabad: 249.6mm
Chandigarh: 262.1mm
Jaipur: 263.8mm
Imphal: 264.6mm
Shimla: 271mm
Thiruvananthapuram: 307 mms
Agartala: 391.2mm
Dehradun: 398.7mm
Mumbai santacruz: 513 mm
Panjim: 733mm
Port Blair: 754.1mm
Cherrapunji: 974 mms
Mangaluru: 1257.1mm
Rainfall Total of May 2025 (with normal in Brackets)👇
Mumbai:
Mumbai Colaba: 503 mms ( 16mms). ...Record for May beating 218 mms in 1918.
Heaviest 27th 24 hrs fall of 162 mms on 27th May broke the previous May Record of 128 mms in 2000.
Mumbai Scruz: 378 mms ( 18 mms)....Scruz record of 388 mms in 2000 hold good !
Mumbai Avg. May month Average Max in 2025 is 33.5c...Day/Night Average 30.0c...Normal Average is 30.5c
------------------------------------------------------------
2. Pune:
One of the coolest May on record for Mumbai & Pune....With coldest May Day ever for Pune at 24.8c on 27th...
Pune: 240.2 mms ( 30 mms) Record for May beating 182 mm in 1933
Mahabaleshwar: 445 mms ( 67 mms)
Matheran : 551 mms
Guhagarh: 707 mms
Mormugao : 700 mms
Panjim: 637 mms ( 65 mms)
Dabolim : 680 mms
Mapusa: 693 mms
----Cherrapunji : 1437 mms---------------------------------------------------------------------------------------------------------------------
Compiled by Vagarian Vineet
A severe, or extreme heatwave, occurs when the daytime maximum temperature settles at 6.5 degrees above normal or more.
Mumbai saw heatwave events in 1977, 1981, 1985, 1989, 1995, 2005, 2009, 2013, 2014 and 2018. Severe heatwaves occurred in 2004, 2011, March 2022, 2023, 2024, 2025.
Mumbai’s average annual temperature has remained consistently above normal for the last 16 years, and data shows that the city is getting hotter. Between 1973 and 1998, the annual mean temperature of the city showed an average departure from normal of +0.004 degrees Celsius per year, which rose to +0.011 degrees Celsius per year between 1999 and 2008, and then further to +0.042 degrees Celsius/year between 2009 and 2020.
Actually for Mumbai, More stress is on Urban Heat islands Effect :
“The overall air temperature trend highlights warming related to global climate change, whereas the trend of increase in late evening and night-time temperature points to a much more localized phenomenon associated with city-scale urbanization and development. The long-term trends of increasing night-time and evening temperatures correspond well with the concept of urban expansion, whereas the rise in post-monsoon and winter temperature trends point to the post-monsoon heat phenomenon,” the MCAP states, though the raw data has not been provided.
India Heat Waves
.png)


Final Figures for Mumbai Monsoon 2023
Santacruz 2978 mm ( 117.2 ")
Colaba 2398 mms ( 94.5")
Ending on good note with Lakes at 99.3% full...enough storage till next monsoon.
Monsoon to completely withdraw by 4th October..4 days before official date of 8th.
2nd & 3rd October: Light drizzles in some parts.
4th October:Almost dry as Monsoon over. Sunny and hotter.
Compare with Maharashtra Coast

.outh West Monsoon Rainfalls (Seasonal) 2023
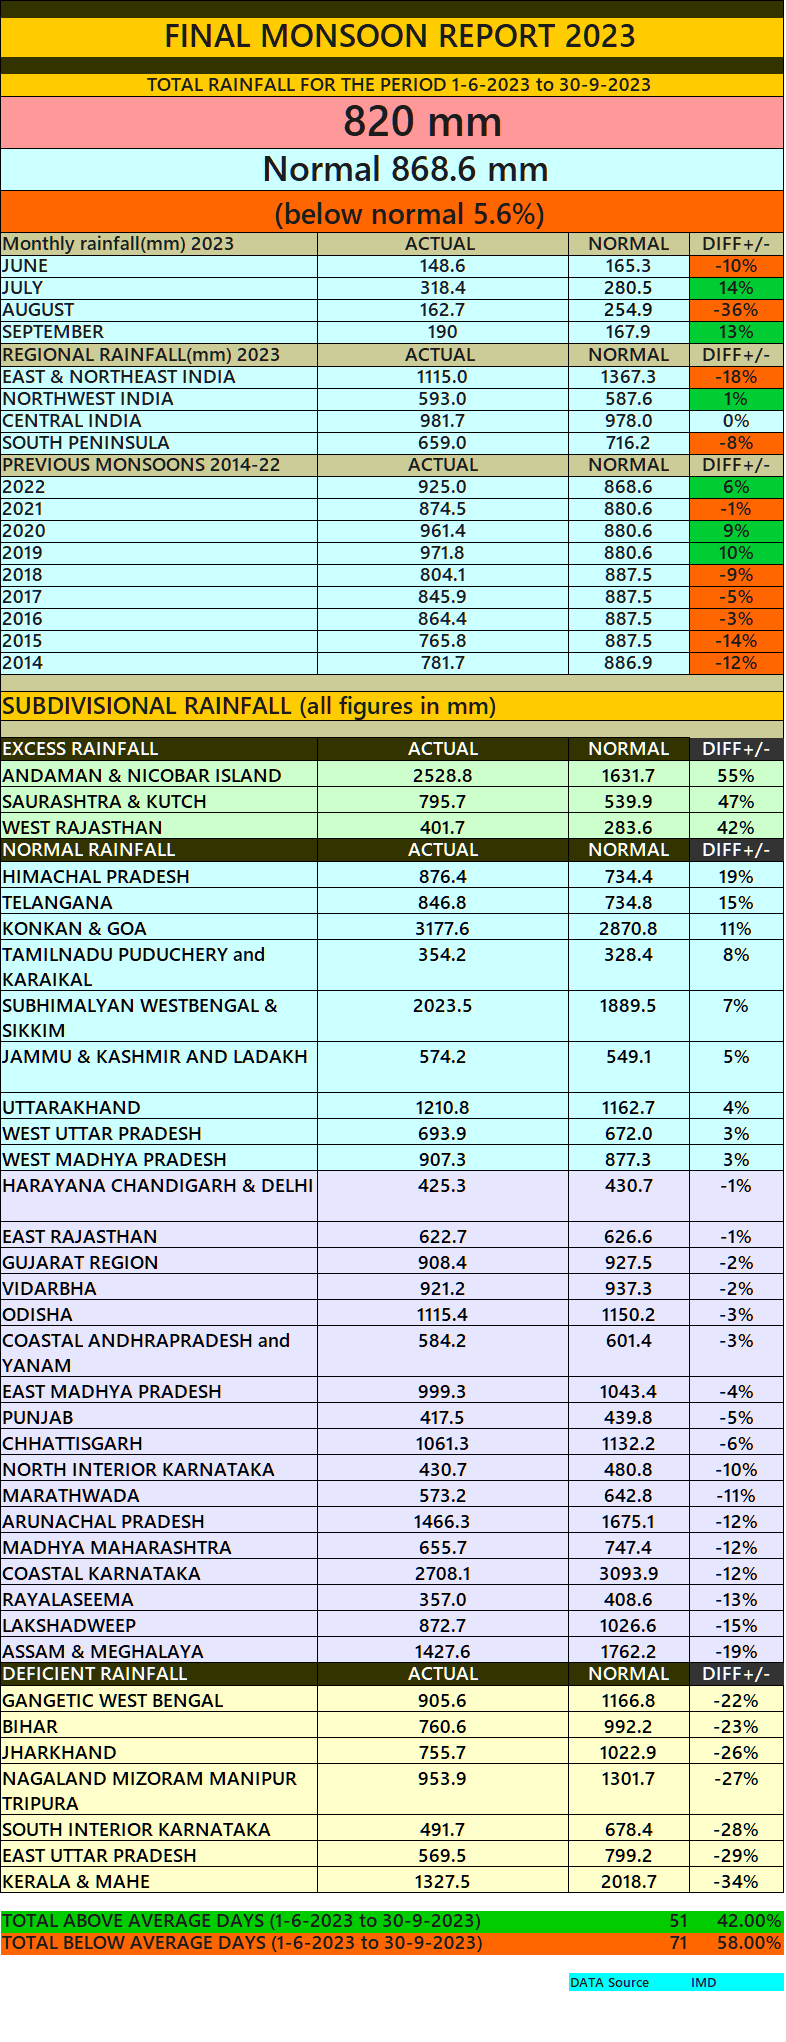
All India deficit at -5.6%. ( In spite of El Nino threat)

Dahanu: 2177mm
Boisar: 2588mm
Palghar: 3490mm
Virar: 2764mm
Vasai: 2954mm
Thane: 3398mm
Santacruz: 2978mm
Colaba: 2398mm
Alibag: 2231mm
Badlapur: 4428mm (1)
Panvel: 3506mm
Pen: 4302mm (2)
Roha: 3293mm
Murud: 2655mm
Shriwardhan: 2890mm
Mangaon: 3950mm (5)
Mahad: 3806mm (6)
Harnai: 2749mm
Poladpur: 3951mm (4)
Dapoli: 4000mm (3)
Guhagar: 3021mm
Chiplun: 3603mm
Ratnagiri: 2550mm
Pawas: 2454mm
Lanja: 3341mm
Devgad: 2751mm
Jaitapur: 2370mm
Malvan: 2618mm
Vengurla: 2758mm
Pernem: 3431mm
Sanquelim: 3250mm
Panaji: 3272mm
Marmugao: 2917mm
Quepem: 3721mm
Sanguem: 3561mm
Canacona: 3171mm
Data Credits: IMD & Agri Department
Compiled by: Vagarian Abhishek Apte
Pune Shivajinagar rain this monsoon season: 446.2mm, which is 26% below normal.2023
Most rainy month of the season: September.
Highest 24hrs rainfall was 37.9mm on 27 September

No. of rainy days in monsoon (1 June-30 September)
2023: 44 days
2022:48 days
2021:42 days
Monsoon rain (1 June-30 September) yearwise
2023:446.2mm
2022:817.4mm
2021:469.7mm
Data: IMD
Delhi rain performance Monsoon 2023
Delhi Safdarjung recorded 660.8mm rain this monsoon season, out of this 70% of rain occurred in just 7 days.
For the 1st time in last 13years, both August and September simultaneously recorded less than 100mm rain.
Below Graph shows daily rain variation in Delhi this season. Data IMD
 Number of days with rain greater 100 mm = 2 daysNumber of Rainy days in June = 8 daysNumber of Rainy days in July = 10 daysNumber of Rainy days in August = 3 daysNumber of Rainy days in September = 5 days
Delhi Safdarjung recorded 660.8mm rain this monsoon season, out of this 70% of rain occurred in just 7 days.
For the 1st time in last 13years, both August and September simultaneously recorded less than 100mm rain.
Below Graph shows daily rain variation in Delhi this season. Data IMD

FINAL MONSOON REPORT 2023
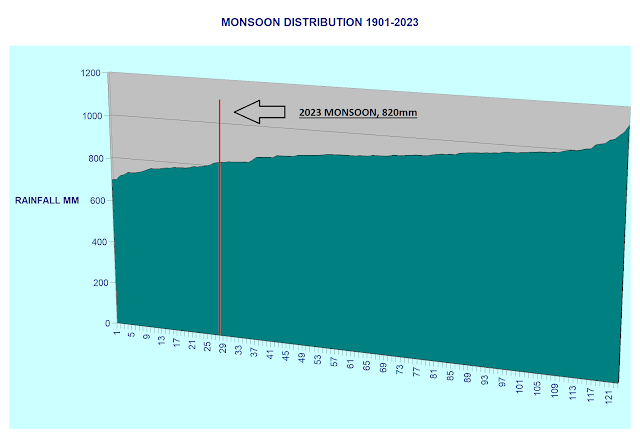
This monsoon had an August that saw a rainfall deficit of 36%!! A good September that gave us 13% above normal rainfall made up the August deficit somewhat but we still ended this monsoon with one of the 30 lowest monsoon rainfall since 1901. As seen in the figure below the red line shows the present monsoon status and where it lies on the monsoon distribution curve since 1901. A total of 27 years have seen lower monsoon rainfall than 2023 since 1901. 1972 with 697.4 mm saw the lowest monsoon rainfall in this period.
In this century 2018 (802.7 mm), 2015 (765.8 mm), 2014 (781.7 mm), 2009 (698.2 mm), 2004 (774.2 mm), 2002 (737.3 mm) were years with monsoon rainfall lower than 2023.
X-axis represents years with monsoon rainfall starting from lowest of 697.4mm in 1972 (extreme left) to 1124.2 mm in 1917 (extreme right).
Research on Arabian Sea Cyclones by Vag.Shitij Jain.
I have conducted a research and have found that post monsoon months i.e. in October and November, the cyclones/depressions crossing Gujarat from Arabian sea have decreased considerably as compared with 100 years ago.
When compared to late 19th century period, from 1892 year to 1916 year 13 cyclones/depressions formed in Arabian sea in Oct & Nov month out of which 4 cyclones crossed Gujarat. This works out to 31%.
From 1936 to 1960 20 systems formed out of which 8 systems made landfall over Gujarat/konkan which comes to whopping 40%!!!!! And just 2 cyclones managed to move to Oman rest all died in sea itself!
But in recent years from 1998 to 2022, 31 cyclones/depressions have formed in Arabian sea out of which 5 systems have managed to made landfall into Gujarat that comes to only 16%.
This monsoon had an August that saw a rainfall deficit of 36%!! A good September that gave us 13% above normal rainfall made up the August deficit somewhat but we still ended this monsoon with one of the 30 lowest monsoon rainfall since 1901. As seen in the figure below the red line shows the present monsoon status and where it lies on the monsoon distribution curve since 1901. A total of 27 years have seen lower monsoon rainfall than 2023 since 1901. 1972 with 697.4 mm saw the lowest monsoon rainfall in this period.
In this century 2018 (802.7 mm), 2015 (765.8 mm), 2014 (781.7 mm), 2009 (698.2 mm), 2004 (774.2 mm), 2002 (737.3 mm) were years with monsoon rainfall lower than 2023.
X-axis represents years with monsoon rainfall starting from lowest of 697.4mm in 1972 (extreme left) to 1124.2 mm in 1917 (extreme right).

May 2021month total rainfall in some cities of Maharashtra:-
1.Ratnagiri:537.3mms
2.Mahabaleshwar:279.8mms
3.Mumbai Colaba:258mms
4.Mumbai Santacruz:256mms
5.Thane:228.4mms
6.Kolhapur:122.5mms
7.Pune:88.8mms
8.Solapur:86.9mms
9.Nashik:52.3mms
10.Aurangabad:35mms
 MONSOON REPORT (1-8-2014 TO 15-8-2014) | |
| TOTAL ALL INDIA RAINFALL (as on 15-8-2014) | 490.4 mm |
| SEASON +/- | -17% |
| RAINFALL THIS FORTNIGHT (from 1-8-2014) | 137.2 mm |
| TO ACHIEVE BY 30TH SEPTEMBER required per day-------> | mm |
| MINIMUM 700 mm | 4.56 |
| AVERAGE 890 mm | 8.69 |
| MAXIMUM 1100 mm | 13.25 |
| CURRENT RAINFALL PER DAY | 6.45 mm |
| AVERAGE RAINFALL PER DAY THIS FORTNIGHT | 9.15 mm |
| REQUIRED PER DAY TO ACHIEVE AUG NORMAL (262 mm) | 7.8 mm |
| TOP FIVE SUBDIVISIONS THIS FORTNIGHT | mm |
| COASTAL KARNATAKA | 717.4 |
| KERALA | 429.9 |
| KONKAN & GOA | 391.9 |
| ODISHA | 265.3 |
| ARUNACHAL PRADESH | 261.0 |
| BOTTOM FIVE SUBDIVISIONS THIS FORTNIGHT | mm |
| N. I. KARNATAKA | 31.5 |
| TELANGANA | 30.2 |
| HAR. CHD & DELHI | 28.1 |
| MARATHWADA | 28.0 |
| RAYALASEEMA | 16.0 |
| TOP FOUR SUBDIVISIONS ABOVE NORMAL (as on 15th August) | |
| ODISHA | 15% |
| S. I. KARNATAKA | 14% |
| EAST RAJASTHAN | 11% |
| A & N ISLAND | 3% |
| BOTTOM SIX SUBDIVISIONS BELOW NORMAL (as on 15th August) | |
| JAMMU & KASHMIR | -47% |
| WEST U.P. | -49% |
| TELANGANA | -53% |
| HAR. CHD & DELHI | -58% |
| PUNJAB | -60% |
| MARATHWADA | -61% |
| TOTAL ABOVE AVERAGE DAYS (1-6-2014 to 15-8-2014) | 24 (32%) |
| TOTAL BELOW AVERAGE DAYS (1-6-2014 to 15-8-2014) | 52 (68%) |
| TOTAL ABOVE AVERAGE DAYS IN AUGUST TILL DATE | 7 (47%) |
| TOTAL BELOW AVERAGE DAYS IN AUGUST TILL DATE | 8 (53%) |
TOTAL ALL INDIA RAINFALL (as on 31-7-2014)
353.2
SEASON +/-
-22%
RAINFALL THIS FORTNIGHT (from 16-7-2014)
172.7 mm
TO ACHIEVE BY 30TH SEPTEMBER required per day------->
mm
MINIMUM 700 mm
5.69
AVERAGE 890 mm
8.8
MAXIMUM 1100 mm
12.24
CURRENT RAINFALL PER DAY
5.79 mm
AVERAGE RAINFALL PER DAY THIS FORTNIGHT
10.79 mm
REQUIRED PER DAY TO ACHIEVE AUG NORMAL (262 mm)
8.45 mm
TOP FIVE SUBDIVISIONS THIS FORTNIGHT
mm
KONKAN & GOA
813.0
COASTAL KARNATAKA
672.0
KERALA
368.3
UTTARAKHAND
357.6
ODISHA
338.1
BOTTOM FIVE SUBDIVISIONS THIS FORTNIGHT
mm
HAR. CHD & DELHI
51.4
MARATHWADA
44.0
LAKSHADWEEP
32.8
TAMILNADU & PONDICHERRY
15.5
RAYALASEEMA
13.0
TOP THREE SUBDIVISIONS ABOVE NORMAL (as on 31st July)
mm
ODISHA
6%
S. I. KARNATAKA
6%
A & N ISLAND
4%
(ONLY THREE SUBDIVISIONS ARE ABOVE NORMAL TILL DATE
that is why I have given ten subdivisions that are below normal)
BOTTOM TEN SUBDIVISIONS BELOW NORMAL (as on 31st July)
mm
COASTAL ANDHRA PRADESH
-33%
HIMACHAL PRADESH
-34%
LAKSHADWEEP
-42%
WEST U.P.
-47%
JAMMU & KASHMIR
-47%
TELANGANA
-47%
N M M T
-48%
HAR. CHD & DELHI
-54%
PUNJAB
-58%
MARATHWADA
-59%
TOTAL ABOVE AVERAGE DAYS (1-6-2014 to 31-7-2014)
17 (28%)
TOTAL BELOW AVERAGE DAYS (1-6-2014 to 31-7-2014)
44 (72%)
TOTAL ABOVE AVERAGE DAYS IN JULY
14 (45%)
TOTAL BELOW AVERAGE DAYS IN JULY
17 (55%)
source -IMD

| Analysis of SWM as of 31st August 2013 by GSB. MONSOON REPORT (16-8-2013 TO 31-8-2013) | |
| TOTAL ALL INDIA RAINFALL (as on 31-7-2013) | 785.3 mm |
| SEASON +/- | +10% |
| RAINFALL THIS FORTNIGHT | 118.4 mm |
| TO ACHIEVE BY 30TH SEPTEMBER | |
| MINIMUM | Achieved |
| AVERAGE | 3.49 mm |
| MAXIMUM | 10.49 mm |
| CURRENT RAINFALL PER DAY | 8.54 mm |
| TOP FIVE SUBDIVISIONS THIS FORTNIGHT | |
| EAST MADHYA PRADESH | 320.7 mm |
| COASTAL KARNATAKA | 313.5 mm |
| GANGETIC WEST BENGAL | 274.9 mm |
| WEST MADHYA PRADESH | 236.4 mm |
| KONKAN & GOA | 216.4 mm |
| BOTTOM FIVE SUBDIVISIONS THIS FORTNIGHT | |
| MARATHWADA | 36.9 mm |
| N. I. KARNATAKA | 35.8 mm |
| RAYALASEEMA | 35.5 mm |
| LAKSHADWEEP | 29.5 mm |
| SAURASHTRA & KUTCH | 16.6 mm |
Based on Karthik Raghavan's compilation of Rainfall of AUG/SEP-NEM relation yesterday...a fellow blogger named Srikkanth has come up with a probability analysis


SWM in Tamil Nadu..Latest Position by Karthik Raghavan

Pondicherry August Cilmatology...Analysis by Karthik Raghavan...Posted 14th August 2013
—————————————-
Average Rainfall(1970-200) = 132.3mm
Highest Monthly Rf = 276.0mm(August 1973)
Highest 24 hr-rf = 118.6mm(16/08/1997)
Last 5 years August rainfall
————————————-
2012 – 92.1mm
2011 – 253.3mm
2010 – 158.8mm
2009 -83.2mm
2008 – 74.2mm
Highest 24 hr rainfall in last 5 years(Aug) – 102.2mm(11/08/2011)
2013 August so far – 261.5mm …
Karthik Raghavan's Excellent Analysis of Tamil Nadu Weather Summary 2013. Superb Presentation ! Its in Detail and can be viewed Here.
From Karthik Raghavan Below
 MONSOON REPORT (16-7-2013 TO 31-7-2013) Compiled and Prepared by GSB |
|
| TOTAL ALL INDIA RAINFALL (as on 31-7-2013) | 527.9 mm |
| SEASON +/- | +17% |
| RAINFALL THIS FORTNIGHT | 178.2 mm |
| TO ACHIEVE BY 30TH SEPTEMBER | |
| MINIMUM |
2.82 mm |
| AVERAGE |
5.94 mm |
| MAXIMUM |
9.38 mm |
| CURRENT RAINFALL PER DAY | 8.65 mm |
| TOP FIVE SUBDIVISIONS THIS FORTNIGHT | |
| KONKAN & GOA | 803.3 mm |
| COASTAL KARNATAKA | 777.0 mm |
| KERALA | 410.0 mm |
| VIDARBHA | 346.4 mm |
| EAST MADHYA PRADESH | 283.4 mm |
| BOTTOM FIVE SUBDIVISIONS THIS FORTNIGHT | |
| PUNJAB | 67.7 mm |
| HAR. CHD & DELHI | 59.1 mm |
| BIHAR | 52.6 mm |
| RAYALASEEMA | 31.8 mm |
| TAMILNADU & PONDICHERRY | 09.8 mm |
Diagram by Rohit Aroskar |
|
x--------------------------------x---------------------------------------x---------------------------------x---------------x
More Information from Rohit Aroskar

Hills Rainfall till 21st July...By Rohit Aroskar..


Monsoon Analysis : 1st July-15th July...From GSB Our expert analyst)
MOONSON REPORT (1-7-2013 to 15-7-2013)
|
| TOTAL ALL INDIA RAINFALL (SEASON+/-) |
| As on 15-07-2013 349.7 mm (+17%) |
| RAINFALL THIS FORTHNIGHT 133.4 mm |
| TO ACHIEVE BY 30TH SEPTEMBER |
| MINIMUM 700 mm 4.55 mm |
| AVERAGE 890 mm 7.02 mm |
| MAXIMUM 1100 mm 9.74 mm |
| CURRENT RAINFALL(per day) is 7.77 mm |
| TOP FIVE SUBDIVISIONS THIS FORTNIGHT |
| COASTAL KARNATAKA |
| KONKAN & GOA |
| KERALA |
| SHWB & SIKKIM |
| A & N ISLAND |
| BOTTOM FIVE SUBDIVISIONS THIS FORTNIGHT |
| PUNJAB |
| GANGETIC WEST BENGAL |
| HAR. CHD & DELHI |
| WEST RAJASTHAN |
| TAMILNADU & PONDICHERRY |
| TOTAL ABOVE AVERAGE DAYS THIS FORTNIGHT 08 |
| TOTAL ABOVE AVERAGE DAYS THIS SEASON 30 (67%) |
| TOTAL BELOW AVERAGE DAYS THIS SEASON 15 (33%) |
| |
Graphical Analysis compiled by Rohit Aroskar


| TOTAL ALL INDIA RAINFALL (SEASON+/-) |
| As on 30-6-2013 216.3 mm (+32%) |
| RAINFALL THIS FORTNIGHT 128.5 mm |
| TO ACHIEVE BY 30TH SEPTEMBER |
| MINIMUM 700 mm 5.26 mm |
| AVERAGE 890 mm 7.32 mm |
| MAXIMUM 1100 mm 9.61 mm |
| CURRENT RAINFALL(per day) is 7.21 mm |
| TOP FIVE SUBDIVISIONS THIS FORTNIGHT |
| KERALA |
| KONKAN & GOA 577.3 mm |
| COASTAL KARNATAKA 556.2 mm |
| A & N ISLAND |
| UTTARAKHAND |
| BOTTOM FIVE SUBDIVISIONS THIS FORTNIGHT |
| COASTAL ANDHRA PRADESH 33.9 mm |
| N. I. KARNATAKA |
| TAMILNADU & PONDICHERRY 30.6 mm |
| WEST RAJASTHAN 16.0 mm |
| RAYALASEEMA |
- From 1901 to 2010 June Rainfall was over 210 mm in 14 years.
- The highest was in 1938 with 277.2 mm
- The average in these 14 years was 228.8 mm
- This year we acheived 216.3 mm in the month of June.
- This was the 10th best June since 1901.
- A June figure of over 210mm is followed by a July with an average of 292.2 mm.
- The best such July was in 1946 with 323mm rainfall.
- Overall whenever we have a June total of more than 210mm ......
- 11 times in these 14 years we got a total monsoon figure in excess of 900mm.
- 4 times the monsoon figure was above 1000mm.
- Once it was over 1100mm (1917).
- Only three times the monsoon figure was below 900mm. (1971 - 885.7mm , 2001 - 821.9mm , 1913 - 784.3mm)
- The total average for the monsoon overall (June to Sep) was 962.7 mm whenever the June total was over 210mm.

State Capitals of IndiaRain till June 20th 2013..Graphics by Rohit Aroskar..

SWM monsoon rainfall .. Till 19th June 2013..Konkan , Ghats and some parts of Madhya Maharahtra...compiled by Rohit Aroskar


Much Awaited Analysis from ..None Other than Our GSB..
SWM Toppers List as on 10th June ...from Pradeep
- Kannur (Kerala) - 606
- Vadakara (Kerala) - 590
- Cherrapunji (Meghalaya) -554
- Dapoli (Maharashtra) - 529
- Tulshi Lake (Maharashtra) - 528
- Gaganbawada (Maharashtra) - 525
- Kalimpong (West Bengal) - 513
- Guhagar (Maharashtra) - 488
- Mangalore (Karnataka) - 480
- Irukkur (Kerala) - 475
- Surathkal (Karnataka) - 465
- Baindur (Karnataka) - 461
- Buxaduar (West Bengal) - 460
- Kudulu (Kerala) - 460
- Thamarasery (Kerala) - 450
- Thane Belapur (Maharashtra) - 439
- Mulki (Karnataka) - 435
- Hosdurg (Kerala) - 430
- Pilicode (Kerala) - 430
- Kundapur (Karnataka) - 428
- Ratnagiri (Maharashtra) - 426
- Gazoldoba (West Bengal) - 410
- Sawantawadi (Maharashtra) - 403
- Alappuzha (Kerala) - 400
- Kumta (Karnataka) - 400
Kozhikode ,North Kerala ..God's own country ..Seems God likes it warm and humid ..
The region lacks winters ..Dec /Jan averages 33/23..Monsoons are when the temp are lowest(29/24) ..But its humid during monsoons ..April is the warmest month..
In fact , Kerala is warmer than Chennai from Nov to Feb ..
Best season : Dec , Jan ,May (though its almost uniformly warm and humid)
... good for a plate of rice curry and coconut water..
Past 10 year averages for Kozhikode,Kerala-
Jan : 33/23.2 , Feb:33.5/24 ,Mar:34.1/25.7 , Apr:34.5 /26.4, May:33.4/26.1, Jun:30.7/24.4,
Jul:29.7/24 , Aug:29.9/24 , Sep:30.8/24.2, Oct:31.9 /24.4 , Nov:32.5 /24.1 , Dec:32.9 / 23.2 ..
Annual Rain-326 cms ,Annual avg temp -32.2/24.5(28.4)
Highest temp-36.8 c (20th Apr 2012) , Lowest temp- 19.9 c (7th Dec 2006)...from Rohit Aroskar
Past 10 year averages of North Goa plains...compiled by Rohit Aroskar
Goa - the land of fun ,frolic and b(r)eaches.. and yes, some sunny ,warm weather..
Almost similar weather like Mumbai most of the times ..
Best season to visit : climate wise- Nov to Feb , otherwise-anytime ..
Past 10 year averages of North Goa plains [Ratnagiri averages are considered ,as they are more representative of North Goa climate than Panjim]-
...
Jan : 32.3/18.2 , Feb:32.3/18.9 ,Mar:32.6/21.7 , Apr:33 /24.2, May:33.5/25.8, Jun:30.7/24.8,
Jul:29/24.3, Aug:28.9/24.1 , Sep:29.7/23.7, Oct:33.1 /23.1 , Nov:34.1 /21.9 , Dec:33.3/19.5 ..
Annual Rain-329 cms ,Annual avg temp -31.9/22.5 (27.2)
Highest temp-40.6 c (16th March 2011) , Lowest temp- 11.6 c (9th Feb 2008)
Nor'wester Wind speeds in India till 17th May, 2013...From Pradeep's Blog
- Alipore, West Bengal - 116 km/hr on 17th April, 2013
- Diamond Harbour, West Bengal - 116 km/hr on 17th April, 2013
- Gaya, Bihar - 96 km/hr on 17th April, 2013
- Tezpur, Assam - 93 km/hr on 3rd April, 2013
- Guwahati, Assam - 80 km/hr on 14th April, 2013
- Alipore, West Bengal - 76 km/hr on 12th May, 2013
- Agartala, Tripura - 74 km/hr on 19th April, 2013
- Dum Dum, West Bengal - 68 km/hr on 17th April, 2013
- Puri, Orissa - 64 km/hr on 21st April, 2013
- Alipore, West Bengal - 63 km/hr on 11th April, 2013
- Daltonganj, Jharkhand - 62 km/hr on 13th April, 2013
- Alipore, West Bengal - 60 km/hr on 4th April, 2013
- Alipore, West Bengal - 60 km/hr on 17th May, 2013
- Patna, Bihar - 58 km/hr on 14th April, 2013
- Dum Dum, West Bengal - 56 km/hr on 17th May, 2013
- Chandbali, Orissa - 56 km/hr on 7th May, 2013
- Daltonganj, Jharkhand - 56 km/hr on 14th April, 2013
- Daltonganj, Jharkhand - 56 km/hr on 2nd April, 2013
- Alipore, West Bengal - 56 km/hr on 21st April, 2013
- Alipore, West Bengal - 56 km/hr on 15th April, 2013
- Digha, West Bengal - 55 km/hr on 19th April, 2013
- Malda, West Bengal - 50 km/hr on 17th May, 2013
- Chandbali, Orissa - 56 km/hr on 15th April, 2013
- Guwahati, Assam - 48 km/hr on 18th April, 2013
- Sriniketan, West Bengal - 44 km/hr on 12th May, 2013
- Malda, West Bengal - 44 km/hr on 17th April, 2013
Maharashtra Analysis For Jan-Apr 2013...from Rohit...

Monthly Averages This year:
Pune: Jan : 31/11.3 , Feb :32.6 / 14.1 , Mar:35.5/15.5 , Apr:37.7/17.7*(min apr temp estimated )
Mumbai: Jan : 30.9/14.8 , Feb :31.6 / 17.4 , Mar:34/19.3 , Apr:33/22.1
Rain: 0 mms ..Highest temp :40.5..Lowest temp:10.4 c ..
Interesting Information from Arpit for today's Readings 94th May 2013): ..All cities from India
Cities with temperature difference of atleast 20c today...
Hisar-43/17=26c
Sriganganagar-43.9/18.5=25.4c
Agra-43.3/19.3=24c
Churu-44.5/20.7=23.8c
Gwalior-42.7/19.6=23.1c
Lucknow-41.3/18.3=23c
Meerut-40.9/18.1=22.8c
New Delhi(S'jung)-42/19.8=22.2c
Satna-42.5/20.9=21.6c
Allahabad-44.2/22.6=21.6c
Amritsar-40.4/18.8=21.6c
Gaya-43/21.5=21.5c
Varanasi-43/21.6=21.4c
Nagpur-44.8/24.2=20.6c
Patiala-40.4/19.9=20.5c
Aligarh-41.4/21=20.4c
Sultanpur-40.2/20=20.2c
Mumbai SCZ (April 2013 avg temp): 33 c (0) / 22.1 c(-2) ..
Lowest : Max temp : 30.8 c , Min temp:19.2 c , daily range : 8.1 c
Highest : Max temp :37.3 c, Min temp : 24.8, daily range : 14.3 c
Rain in mms - 0

From Rohit
Mumbai Santa Cruz Analysis of 50 days of Summer (half the Total days)
SCZ average temp [50(50%) days of summer : 1 Mar-19 Apr ] : 33.4 c/20.0 c....Normal for these 50 days should be 32.9 - 22.2
Max temp range :30.2-40.5 c ,Min temp range: 15.6 c - 23.6 c ..
Highest daily range(23.9 c) ,Lowest daily range( 8.8 c)..
Min temp below 20 c : 19 days..
Rain in mms: 0
From Rohit.....Posted on 20th April 2013
Top 50 DISTRICTS RAINFALL MARCH 2013....compiled by GSB
| DISTRICT | STATE/SUBDIVISION | ACTUAL | NORMAL | %DEP |
| (MM) | (MM) | |||
UPPER SIANG
|
ARUNACH PRADESH
|
246.8
|
384.7
|
-36%
|
TAWANG
|
ARUNACH PRADESH
|
220.0
|
67.5
|
226%
|
DIBANG VALLEY
|
ARUNACH PRADESH
|
195.0
|
373.0
|
-48%
|
LOHIT
|
ARUNACH PRADESH
|
184.9
|
211.2
|
-12%
|
TINSUKIA
|
ASSAM
|
158.9
|
156.4
|
2%
|
EAST SIKKIM
|
SIKKIM
|
143.4
|
73.1
|
96%
|
NORTH SIKKIM
|
SIKKIM
|
140.8
|
216.5
|
-35%
|
PAPUMPARA
|
ARUNACH PRADESH
|
136.1
|
123.9
|
10%
|
DIBRUGARH
|
ASSAM
|
130.0
|
140.4
|
-7%
|
TIRAP
|
ARUNACH PRADESH
|
125.7
|
171.5
|
-27%
|
LOWER DIBANG VALLEY
|
ARUNACH PRADESH
|
123.0
|
373.0
|
-67%
|
WEST SIANG
|
ARUNACH PRADESH
|
122.5
|
105.8
|
16%
|
KOTTAYAM
|
KERALA
|
121.4
|
52.4
|
132%
|
TIRUNELVELI
|
TAMIL NADU
|
120.3
|
53.9
|
123%
|
KULLU
|
HIMACHAL PRADESH
|
117.1
|
142.4
|
-18%
|
RAMBAN
|
J & K
|
106.6
|
223.0
|
-52%
|
KUPWARA
|
J & K
|
103.8
|
260.9
|
-60%
|
NICOBAR
|
A & N ISLAND
|
101.2
|
72.8
|
39%
|
KINNAUR
|
HIMACHAL PRADESH
|
96.0
|
121.0
|
-21%
|
KULGAM
|
J & K
|
95.3
|
141.6
|
-33%
|
EAST SIANG
|
ARUNACH PRADESH
|
93.5
|
127.3
|
-27%
|
SIBSAGAR
|
ASSAM
|
93.3
|
88.0
|
6%
|
PATHANAMTHITTA
|
KERALA
|
92.0
|
90.0
|
2%
|
GANDERWAL
|
J & K
|
91.4
|
111.3
|
-18%
|
WEST SIKKIM
|
SIKKIM
|
90.0
|
216.5
|
-58%
|
MOKOKCHUNG
|
NAGALAND
|
88.0
|
70.9
|
24%
|
WYNAD
|
KERALA
|
87.1
|
21.6
|
303%
|
CACHAR
|
ASSAM
|
86.3
|
198.8
|
-57%
|
SHOPIAN
|
J & K
|
86.0
|
127.5
|
-33%
|
BARAMULA
|
J & K
|
85.2
|
204.3
|
-58%
|
KODAGU
|
S I KARNATAKA
|
84.4
|
24.7
|
242%
|
DHEMAJI
|
ASSAM
|
84.0
|
92.4
|
-9%
|
LAHAUL & SPITI
|
HIMACHAL PRADESH
|
83.9
|
185.5
|
-55%
|
HAMIRPUR
|
WEST UP
|
80.8
|
60.3
|
34%
|
N. C. HILLS
|
ASSAM
|
80.6
|
173.6
|
-54%
|
CHANGLANG
|
ARUNACH PRADESH
|
80.5
|
441.5
|
-82%
|
BADGAM
|
J & K
|
80.4
|
113.0
|
-29%
|
SRINAGAR
|
J & K
|
80.3
|
111.3
|
-28%
|
GOLAGHAT
|
ASSAM
|
78.5
|
78.3
|
0%
|
LAKHIMPUR
|
ASSAM
|
78.0
|
92.4
|
-16%
|
DODA
|
J & K
|
75.2
|
223.4
|
-66%
|
TIRUVARUR
|
TAMIL NADU
|
75.2
|
18.3
|
311%
|
SOUTH SIKKIM
|
SIKKIM
|
73.7
|
73.1
|
1%
|
KANGRA
|
HIMACHAL PRADESH
|
72.8
|
88.2
|
-17%
|
SHIMLA
|
HIMACHAL PRADESH
|
71.8
|
84.6
|
-15%
|
MANDI
|
HIMACHAL PRADESH
|
71.5
|
86.0
|
-17%
|
ANANTNAG
|
J & K
|
71.3
|
162.3
|
-56%
|
PUDUKKOTTAI
|
TAMIL NADU
|
71.3
|
15.2
|
369%
|
CHAMBA
|
HIMACHAL PRADESH
|
68.9
|
125.5
|
-45%
|
RAJOURI
|
J & K
|
68.2
|
62.4
|
9%
|
| | ||||
| Source: | IMD (Data from 1-3-2013 to 3-4- 2013) |
Mumbai Analysis for March 2103 ...by Rohit Aroskar
March 2013:
Min temp below 20 c at SCZ : 18 times,
Max temp below 32 c at SCZ: 10 times, Max temp above 35 c at SCZ : 8 times
Mar avg temp for SCZ decoded-
1-8 Mar (when high pressure ridge was sitting on Mumbai)- 38.9 / 17.2
9-31 Mar (after the ridge dissapeared) - 32.3 / 20.1
For SCZ
Lowest max temp:30.2 (13th March) , Highest max temp:40.5 (7th march)
Lowest min temp - 15.6 ( 4th,5th March) , Highest min temp-23.6 (25th mar)
Highest daily range - 23.9 (5th Mar) , Lowest daily range-9.6 (26th mar)
For CLB max avg.. 1-8 mar - 35.5 c .... 9-31 mar - 31.3 c
At colaba , max temp below 32 c -18 times..max temp above 35 c- 5 times
x---------------------------------------x----------------------------------------------------x----------------------------------------------------------x
Mumbai (SCZ) averages 16.2 c as minimum temp for January..courtesy Rohit Aroskar
Instances of min temp below 15 c continuously -
Jan 2011 - min temp below 15c for 17 consecutive days..
Jan / Feb 2008 - min temp below 15c for 14 consecutive days..
Jan 2013 - min temp below 15c for 11 consecutive days..
Jan 2013 average temp at Mumbai ( SCZ):..sent by Rohit.
Max : 30.9 c
Min : 14.8 c
Monthly Temp Range :10.4 c to 34 c.
Lowest ->Max :27.4 c on 6th Jan2013
Min :10.4 c on 6th Jan2013
Daily Range:9.6 c on 2nd JanHighest ->Max :34 c on 9th Jan 2013
Min :21 c on 2nd Jan 2013Daily Range:19.1 c on 13th Jan
Recent Single digit temp at Mumbai Airport..All are in Feb :
6th feb 2008: 9.4 c
8th Feb 2008: 8.5 c
9th Feb 2008: 8.6 c
9th Feb 2012: 8.8 c
Highest 24 hrs Period rainfall in India in Cms:...Thanks pradeep
6/5/2004 AMINI DEVI : 116.8
27/7/2005 Vihar Lake 105.0
14/6/1876 CHERAPUNJI: 103.6
12/7/1910 CHERAPUNJI : 99.8
18/6/1899 KASAULI : 99.6
10/7/1952 MOWSIMRAM 98.9
2/7/1941 DHARAMPUR 98.7
13/9/1974 CHERAPUNJI 98.5
27/7/2005 SANTACRUZ 94.4(9th Rank)
TOP 50 DISTRICTS POST MONSoON RAINFALL...compiled by GSB.
| DISTRICT | STATE/SUBDIVISION | ACTUAL | NORMAL |
DEP%
|
| (mm) | (mm) | |||
| KARAIKAL | PONDICHERRY | 839.5 | 728.5 | 15.24% |
| NAGAPATTINAM | TAMILNADU | 704.3 | 629.7 | 11.85% |
| TIRUVARUR | TAMILNADU | 629.2 | 485.9 | 29.49% |
| EAST SIANG | ARUNACHAL PRADESH | 621.5 | 234.1 | 165.48% |
| PUDUCHERRY | PONDICHERRY | 576.4 | 629.8 | -8.48% |
| CUDDALORE | TAMILNADU | 573.9 | 498.4 | 15.15% |
| WEST GODAVARI | COASTAL ANDHRA | 520.6 | 263.7 | 97.42% |
| EAST GODAVARI | COASTAL ANDHRA | 506.9 | 267.5 | 89.50% |
| NORTH & MIDDLE ANDAMAN | ANDAMAN & NICOBAR ISLANDS | 485.5 | 468.5 | 3.63% |
| VILUPPURAM | TAMILNADU | 478.8 | 369.5 | 29.58% |
| ERNAKULAM | KERALA | 475.4 | 441.8 | 7.61% |
| SOUTH ANDAMAN | ANDAMAN & NICOBAR ISLANDS | 460.6 | 565.4 | -18.54% |
| TIRUNELVELI | TAMILNADU | 441.7 | 357.8 | 23.45% |
| VISHAKHAPATNAM | COASTAL ANDHRA | 438.9 | 262.2 | 67.39% |
| KRISHNA | COASTAL ANDHRA | 433.8 | 229.6 | 88.94% |
| CHENNAI | TAMILNADU | 433.5 | 619.2 | -29.99% |
| NILGIRI | TAMILNADU | 431.1 | 391.6 | 10.09% |
| THANJAVUR | TAMILNADU | 420.4 | 391.9 | 7.27% |
| VIZIANAGARAM | COASTAL ANDHRA | 419.8 | 243.7 | 72.26% |
| KOTTAYAM | KERALA | 419.4 | 490.9 | -14.57% |
| KANCHIPURAM | TAMILNADU | 413.7 | 495.9 | -16.58% |
| PRAKASAM | COASTAL ANDHRA | 411.2 | 293.5 | 40.10% |
| TIRUVANNAMALAI | TAMILNADU | 405.3 | 356.5 | 13.69% |
| TIRUVALLUR | TAMILNADU | 402.2 | 462.9 | -13.11% |
| SRIKAKULAM | COASTAL ANDHRA | 381 | 280.2 | 35.97% |
| KOZHIKODE | KERALA | 374.1 | 390.5 | -4.20% |
| EAST KHASI HILLS | MEGHALAYA | 371.1 | 314 | 18.18% |
| JAINTIA HILLS | MEGHALAYA | 368.2 | 624.6 | -41.05% |
| IDUKKI | KERALA | 360.8 | 511.6 | -29.48% |
| UPPER SIANG | ARUNACHAL PRADESH | 355.3 | 350 | 1.51% |
| GANJAM | ORISSA | 354 | 269 | 31.60% |
| KOLLAM | KERALA | 351.3 | 579.6 | -39.39% |
| NICOBAR | ANDAMAN & NICOBAR ISLANDS | 349.3 | 622.9 | -43.92% |
| KANYAKUMARI | TAMILNADU | 348.7 | 429.9 | -18.89% |
| PAPUMPARA | ARUNACHAL PRADESH | 338.6 | 233.9 | 44.76% |
| RAMANATHAPURAM | TAMILNADU | 333.2 | 360.5 | -7.57% |
| LUNGLEI | MIZORAM | 330.1 | 310 | 6.48% |
| CHITTOOR | RAYALSEEMA | 329.1 | 299.2 | 9.99% |
| GUNTUR | COASTAL ANDHRA | 326.7 | 218.5 | 49.52% |
| NELLORE | COASTAL ANDHRA | 326 | 522.8 | -37.64% |
| VELLORE | TAMILNADU | 320.1 | 282.7 | 13.23% |
| NORTH SIKKIM | SIKKIM | 302.4 | 307 | -1.50% |
| ARIYALUR | TAMILNADU | 302.4 | 389.9 | -22.44% |
| DINDIGUL | TAMILNADU | 301.8 | 341.7 | -11.68% |
| THIRUVANANTHAPURAM | KERALA | 300 | 454.7 | -34.02% |
| N. C. HILLS | ASSAM | 298.2 | 237.5 | 25.56% |
| TOOTHUKUDI | TAMILNADU | 297 | 328 | -9.45% |
| SIVAGANGA | TAMILNADU | 293.7 | 330.3 | -11.08% |
| TRICHY | TAMILNADU | 288.1 | 307 | -6.16% |
| WEST SIANG | ARUNACHAL PRADESH | 284 | 159.5 | 78.06% |
RAINFALL FOR TOP 50 DISTRICTS ALL INDIA OCTOBER 2012. from GSB.
------------------------------
(DISTRICT) ===== (STATE) ====== (ACTUAL, NORMAL , DEVIATION%)
KARAIKAL ============== PONDICHERRY ======== 774.9 275.7 181%
EAST SIANG ============ ARUNACHAL PRADESH = 611.6 206.9 196%
NAGAPATTINAM ========= TAMIL NADU ========== 599.6 241.2 149%
TIRUVARUR ============ TAMIL NADU ========== 531.8 200.3 166%
PUDUCHERRY ========== PONDICHERRY ======== 505.3 270.7 87%
CUDDALORE =========== TAMIL NADU ========== 479.6 220.2 118%
CHENNAI ============== TAMIL NADU ========== 394.3 266.5 48%
VILUPPURAM =========== TAMIL NADU ========== 359.5 186.5 93%
THANJAVUR ============ TAMIL NADU ========== 334.0 183.8 82%
NILGIRI ================ TAMIL NADU ========== 326.2 217.9 50%
KANCHIPURAM ========== TAMIL NADU ========== 318.4 225.8 41%
PAPUMPARA ============ ARUNACHAL PRADESH = 312.4 214.7 46%
WEST GARO HILLS ======= MEGHALAYA ========== 311.9 155.7 100%
TIRUNELVELI ============ TAMIL NADU ========== 302.7 157.5 92%
NORTH SIKKIM =========== SIKKIM ============== 302.4 265.0 14%
EAST KHASI HILLS ======== MEGHALAYA ========== 300.0 277.9 8%
ERNAKULAM ============= KERALA ============= 298.6 299.9 0%
JAINTIA HILLS ============ MEGHALAYA ========== 291.0 517.7 -44%
UPPER SIANG ============ ARUNACHAL PRADESH = 288.4 264.9 9%
RAMANATHAPURAM ======== TAMIL NADU ========== 279.7 182.4 53%
DINDIGUL ================ TAMIL NADU ========== 272.5 188.1 45%
TIRUVALLUR ============= TAMIL NADU ========== 272.5 211.0 29%
LOHIT =================== ARUNACHAL PRADESH = 269.2 167.1 61%
RATNAGIRI =============== MAHARASHTRA ======== 266.1 143.1 86%
NORTH & MIDDLE ANDAMAN = A & N ISLAND ========= 265.9 276.1 -4%
TIRUVANNAMALAI ========== TAMIL NADU ========== 263.9 194.2 36%
KOTTAYAM ================ KERALA ============= 262.5 316.6 -17%
SIVAGANGA =============== TAMIL NADU ========== 258.4 187.1 38%
WEST SIANG ============== ARUNACHAL PRADESH = 255.0 126.8 101%
SAIHA ==================== MIZORAM ============ 255.0 214.2 19%
N. C. HILLS ================ ASSAM ============== 250.9 196.4 28%
DHALAI =================== TRIPURA ============ 246.0 182.8 35%
KARIMGANJ =============== ASSAM ============== 242.0 240.4 1%
KOLLAM ================== KERALA ============= 240.2 362.7 -34%
KOKRAJHAR ============== ASSAM ============== 237.4 159.5 49%
ARIYALUR ================ TAMIL NADU ========== 236.7 193.4 22%
COIMBATORE ============= TAMIL NADU ========== 229.6 151.9 51%
KANYAKUMARI ============ TAMIL NADU ========== 226.6 226.3 0%
RI-BHOI ================= MEGHALAYA ========== 225.4 125.4 80%
BONGAIGAON ============ ASSAM ============== 224.5 168.2 33%
DHUBRI ================= ASSAM ============== 222.9 155.1 44%
COOCH BEHAR =========== WEST BENGAL ======= 222.2 141.3 57%
SOUTH GARO HILLS ======= MEGHALAYA ========== 222.0 155.7 43%
VIRUDHUNAGAR ========== TAMIL NADU ========== 221.9 180.7 23%
PUDUKKOTTAI ============ TAMIL NADU ========== 221.8 158.0 40%
TRICHY ================= TAMIL NADU ========== 218.6 173.2 26%
WEST GODAVARI ========= COASTAL ANDHRA ===== 217.5 197.8 10%
PRAKASAM ============== COASTAL ANDHRA ===== 216.4 181.9 19%
KOZHIKODE ============= KERALA ============= 214.3 262.1 -18%
LUNGLEI =============== MIZORAM ============ 214.0 245.4 -13%
--------------------------------------------------------------------------------------------------------------
Rainfall figures, Cumulative till End October..compiled (as usual) by GSB:
Ratnagiri------ 3881.9
Sindhudurg-- 3278.4
Raigadh------- 2970.7
Thane---------- 2122
Kolhapur------ 1677.3
Gadchiroli---- 1581.7
Chandrapur-- 1319.5
Bhandara----- 1309.5
Gondia-------- 1244.6
Amaravati---- 1046.2
Nagpur-------- 1011.6
Yavatmal----- 949
Satara--------- 918.2
Wardha------- 864.1
Nasik---------- 863.2
Washim------ 846.4
Akola---------- 828.4
Latur----------- 759.8
Nandurbar---- 727.5
Hingoli--------- 709.8
Pune----------- 677
Nanded------- 660.7
Parabhani---- 636.9
Buldhana----- 611.8
Beed----------- 435.1
Solapur------- 411.7
Sangali-------- 407.8
Dhule---------- 406.1
Jalgaon------- 405.1
Osmanabad- 390.9
Ahmadnagar 383.4
Aurangabad- 368.7
Jalna----------- 324.2

ARUNACHAL PRADESH ------- 167.8mm(+19%)
ASSAM & MEGHALAYA -------- 160.7mm(+39%)
SHWB & SIKKIM -------------- 139.3mm(+11%)
NAGAL/MANIP/MEGH/TRIP ----- 135.8mm(+2%)
WEST RAJASTHAN ------------- 1.0mm(-77%)
HIMACHAL PRADESH --------- 0.9mm(-97%)
EAST RAJASTHAN -------------- 0.0mm(-99%)
WEST U.P. ------------------------- 0.0mm(-100%)
NORTH WEST INDIA -------------- 2.5mm(-90%)
CENTRAL INDIA -------------------- 36.4mm(-18%)
SOUTH PENINSULA -------------- 84.6mm(-12%)
MUMBAI (SANTA CRUZ) ------ 168.4mm
BANGALORE ----------------------- 35.0mm
CHENNAI AP ----------------------- 66.0mm
NEW DELHI -------------------------- 0.0mm
HYDERABAD AP ------------------ 72.0mm
KOLKATTA AP -------------------- 152.0mm
PANJIM(GOA) ---------------------- 97.1mm
KALYAN ------------------------------
AMBARNATH ------------------------ 67.6mm
PANVEL ------------------------------
SANGAMNESHWAR -------------- 673.0mm
PUNE CITY --------------------------- 120.2mm
MAHABALESHWAR --------------- 127.8mm
AURANGABAD ---------------------- 55.4mm
NAGPUR CITY ------------------------ 9.1mm
NASIK ------------------------------
RATNAGIRI --------------------------- 292.0mm
Final SWM 2012 Rainfall Toppers - 01.06.12 to 30.09.12 -valuable information from Pradeep.
Cherrapunji the winner way-ahead than others
Compared to last year, when Amagon got over 9000 mm, Kitwade around 8000 mm and Agumbe, Kollur, Amboli all over 7000 mm. The rains are around 1000 to 1500 mm less in most of the stations compared to 2011.
Rainfall in mm (Minimum of 4500 mm)
- Cherrapunji (Meghalaya) - 10436
- Agumbe (Karnataka) - 6721
- Kollur (Karnataka) - 6300
- Kitwade (Maharashtra) - 6263
- Dajipur (Maharashtra) - 6083
- Amboli (Maharashtra) - 6055
- Kogar (Karnataka) - 5950
- Arendur (Karnataka) - 5500
- Amgaon (Karnataka) - 5418 (22 to 31st August rainfall not available)
- Gaganbawda (Maharashtra) - 5402
- Tamini Ghat (Maharashtra) ~ 5300
- Mahabaleshwar (Maharashtra) - 5235
- Patgaon (Maharashtra) - 5214
- Sangameshwar (Maharashtra) - 5201
- Dawadi Ghat (Maharashtra) ~ 5200
- Mulshi Dam (Maharashtra) - 5151
- Gavali (Karnataka) - 5150 (19 to 31st August rainfall not available)
- Albadi (Karnataka) - 5126
- Kasari (Maharashtra) - 5090
- Kerekatte (Karnataka) - 5056
- Castle Rock (Karnataka) - 5045
- Kanakumbi (Karnataka) - 4981
- Nilkund (Karnataka) - 4912
- Talacauvery (Karnataka) - 4881
- Sitanadi (Karnataka) - 4782
- Passighat (Arunachal Pradesh) - 4765
- Mulikar (Karnataka) - 4747
- Kerveshe (Karnataka) - 4714
- Gokarna (Karnataka) - 4646
- Hosakere (Karnataka) - 4624
- Amasebail (Karnataka) - 4500
- Surlabhi (Karnataka) - 4500
- Shiragaon Ghat (Maharashtra) ~ 4800
Driest Toppers Rainfall in mm Cut-off (less than 100 mm)
- Palayamkottai (Tamil Nadu) -16
- Thoothukudi (Tamil Nadu) - 17
- Coimbatore AP (Tamil Nadu) - 19
- Chandrapur (Orissa) - 20
- Pamban (Tamil Nadu) - 35
- Rourkela (Orissa) - 57
- Nandaghat (Orissa) - 79
- Udaygiri (Orissa) - 79
- Kavthemahankal (Maharashtra) - 88
- Tarapur (Orissa) - 90
- Jat (Maharashtra) - 100
- Kolab (Orissa) - 100
- Indapur (Maharashtra) - 100
- Tondi (Tamil Nadu) - 100
India Major Cities SWM rainfall (Population ~ 2 million)
(Rainfall in mm)- Mumbai – 1434
- Nagpur – 1184
- Kolkata – 1118
- Bhopal - 1115
- Patna - 928
- Indore - 890
- Lucknow – 851
- Surat – 825
- Jaipur – 758
- Kanpur - 630
- Hyderabad – 623
- Ahmedabad – 605
- Delhi – 545
- Chennai - 407 *
- Pune – 377
- Bangalore – 331


