Monsoon
Watch - 2...2017 ....22nd April
Further
Analysis of the parameters as discussed in MW-1.
Position
as on 21st April :
1.Cross
Equatorial Winds:
Let
me explain, that the winds on crossing the equator break into 2 branches. i)
gushing into the Arabian Sea, and ii) moving into the Bay of Bengal.
Normal April Winds
Current Winds
During
Monsoon Watch 1 , the cross equatorial flow was weakly forming.
i) The cross equatorial wind flow, has just about picked up in
the Western sector Southern
Hemisphere. Winds, have not yet achieved the required speeds,
but just hitting the East African coast. The Northwards movement of the ITCZ will
surely hasten and strengthen the winds.
ii) In the eastern sector, in the Bay Branch, the Cross
equatorial winds are perfectly diverted and change direction towards SW after
just crossing the Equator. Thunder cloud
(Cb) developments are seen near the region South of the Equator.
And
that is exactly where the start should be for the SWM to arrive at the
Andamans. Upper winds at 100-400 hpa are vigorously aiding the lower
winds to attain the required strength.
The winds hitting Sumatra coast are not Westerly
(as required), and also need to gather strength soon.
We
prefer the Bay Branch to be better organised, as the SW Monsoon is normally
expected there in 22-25 days…
Mascarene high pressure
zones in the South Indian Ocean. Main High reading now 1024 mb and
another one at 1023mb has been observed between Madagascar and Australia.
The
"Power House" of the Monsoon winds is slightly behind schedule, for
this time of the season. But
it is expected to strengthen fast with no tropical storms around.
Indicator : normal
2.
Seasonal Low:
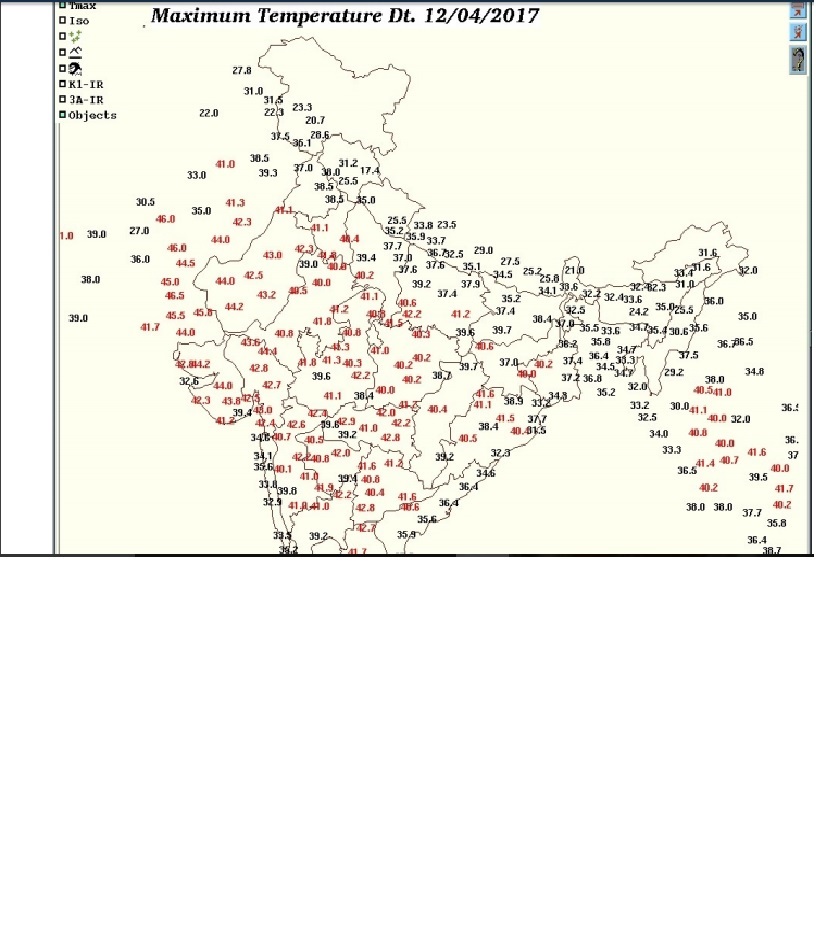
Heat
wave is currently on across North, Central,Western India.
The
core low formation region(Thar desert/Sindh) has heated up early this summer .
Barmer has approached 46 c and recorded min temp above 30 c. April heat records
have tumbled at many locations in the subcontinent. On 19th April
2017, first ever 50 c temperature in April in Asia has been recorded at Larkana
(Sindh).
Temperatures
of more than 45 c have already been recorded in many states of India . Even at Srinagar
(Kashmir),Shimla (Himachal) temperatures have approached around 29 c in April .
Delhi AP was 44.9 c on 20th April 2017.
The
current temperature anomaly. Most
of India is in the 4-7c above normal range and pockets shooting to 15 c above
normal ...
Earlier than normal,the night temperatures have also crossed the 30c mark !
Barmer in Rajasthan recorded 30.4c as minimum on 15th April ,Kurnool (Andhra)
saw a low of 31 c on 19th morning and Jhansi (UP) saw a low of 31.6 c on 21st
morning.
Jaipur,Kota,Bundi,Alwar,Bikaner,Churu,Pilani
(Rajasthan), Cuddapah(Andhra) saw lows of/above 30 c on 21st morning.
Comparison
with previous years shows the difference this year. In 2010, the first 45c touched on
10th. April, and on the same day Nagpur was 44c, Delhi 42.8c. Soon on 15 th
April 2010, Nawabshah (Pakistan) soared to 47c, Simla to 28.2c on 16th,
Ganganagar, Akola and Hissar to to 46c.
But, in 2011, 2012, 2013 and 2014, till date, temperatures were
yet to reach 45c anywhere in the Sub-Continent .
2015...Into the 3rd. week of April , we had seen 48c in Pakistan on 19th
April in Larkana,and 46.5c in Moen Jo Daro. In India had just topped 44.6c in
Barmer on 19th April.
2016....touched 46c in Bankura on 16th April...and was constantly hot in
Eastern region with almost daily ,a place touching 46c.. Bhubaneshwar and
Titlagarh in India and Dadu in Pakistan had touched 46c. Several large regions
in Vidharbh, Telengana and MP were in the 44/43c range.
The seasonal Low, as a result of good
heating, is shaping up fast. It has shown good progress after MW 1 when it was
1008 mb.
Last
2 days, the lowest pressure, in the core (Thar Desert) region was at 998/1000
mb. (In
2011/2014 was 1006 mb, 2010/2012 was at 1002 mb this time. 2015/2016 it was at 1000-1002
mb).
Lows
over MP, Central India, should become less conspicuous because of the
strengthening of the seasonal low over NW india.
As mentioned, it normally should reach a low nadir of 994 mb in June in the
Thar Desert, and with 1008mb in the South Arabian Sea, a
perfect gradient is created to attract the south -west winds
towards the coast.
Thunderstorm
activity in Southern Tibet is seen to be picking up.
The
Line of Wind Discontinuity should normally stabilise around Central India
perpendicular down into the Southern Peninsula by mid April.
This enhances the speed of the Seasonal Low formation. Normally is required to
start taking shape for the monsoon by the second week of April.
LWD (trough)
is currently near the Southern region of the Peninsula…running roughly from
Karnataka towards the Kerala Coast.
Pre –monsoon thunderstorm activity is restricted to
South Karnataka and Kerala. Some activity seen in patches along Coastal A.P. and
Odisha…..after
MW 1 release.
In
reality, this LWD ( full formed) remains till June, in variable phases, and
finally merges with the Monsoon trough (axis)/ITCZ when the ICTZ moves
towards the Sub Continent.
Indicator: normal
3. ENSO: This year also, like last year, we also base our observations
on the Multivariate ENSO Index (MEI). An attempt is made to monitor ENSO
by basing the Multivariate ENSO Index (MEI) on the six main observed variables
over the tropical Pacific.
These six variables are: sea-level pressure (P), zonal (U) and meridional
(V) components of the surface wind, sea surface temperature (S), surface air
temperature (A), and total cloudiness fraction of the sky (C). (Negative values
of the MEI represent the cold ENSO phase, a.k.a.La Niña, while positive MEI
values represent the warm ENSO phase (El Niño).The MEI is computed separately
for each of twelve sliding bi-monthly seasons (Dec/Jan, Jan/Feb,..., Nov/Dec).
Negative values of the MEI represent the cold ENSO phase, a.k.a.La Niña, while
positive MEI values represent the warm ENSO phase (El Niño).
The updated (Feb-Mar) MEI is at -0.08 (in Jan-Feb was -0.056), for a slightly
decreased ranking.
30 day SOI has fallen, and
is now at -3.1 ( SOI of -7 to 7 is neutral. Above 7 is La Nina, and below
-7 is El Nino ).
The Oceanic Nino Index (ONI) is
based on SST departures from average in the Niño 3.4 region, and is a principal
measure for monitoring, assessing, and predicting ENSO. After 5 overlapping
seasons showing towards establishment of La Nina, we see a neutral turn. ONI latest is -0.2... ( ONI of -0.5
to 0.5 is neutral. Above 0.5 is El Nino, and below -0.5 is La Nina).
Indicator: heading towards Neutral.
4. The Bay has hosted a pre monsoon low during
mid April.
As
discussed, we should normally see a low sometime after the 15th of April. The
high pressure region in the Bay, at sea level, no longer prevails.
A strong MJO would hasten the favourable formations and lows, with enhanced
precipitation. But the MJO, it seems will remain
stalled (without eastward propagation) for the next 10 days .
Hence,
not much progress is expected on this front during the next 10 days.
Another
factor, which helps the winds gain strength, and bring more moisture into the
Indian landmass, is the sea temperatures on both sides of the Peninsula.
Optimum (warm) temperatures will hasten and create more clouds, and help in
faster forming of the lows from the Bay. Currently , the sea temperatures on both sides of
the Peninsula are below normal.
We
prefer the Bay parameters to show progress faster , as the SW Monsoon is
expected there in 22-25 days…
Indicator:
-ve
5. To bring the existing
SE winds above the equator (as SW), the ITCZ should move
northwards. Around 1st. of May, this should cross the equator. The ITCZ should
now come back to its Northward position, as
the effective "Lows" created by the Rossby Wave are
reducing.
ITCZ is just south of the equator (1 s).
Indicator:
Normal
So, overall, we can summarise as:
Parameter:
1) Normal 2) Normal
3) Neutral 4) -ve 5) Normal.
Summary : One
parameter is -ve as of today . Parameters
have improved compared to MW 1 .
We will
put up the estimated date of arrival in the MW-3.
But,
situations can change fast, and by the time we discuss the next MW, some
factors can suddenly become +ve or -ve. So, MW discusses and follows the
developments as they emerge, and discuss the parameters as is where is.
No
model can commit today when the Monsoon can arrive.
Quantum
of rain forecasting in April for June right through September is an impossible
task. Things get clearer by last week of April. Vagaries' (in MW) normally
remains true to estimates around early May.
Next MW
up on 2nd May with Dates of Monsoon Arrival.
Major Contribution for this MW by Vagarian Rohit Aroskar.


