The much Awaited Monsoon Watch Series will commence here from 8th April 2019...The Monsoon Watch -1 will be put up on 8th April at 9 pm IST
Sunday, April 07, 2019


Wednesday, April 03, 2019
Sunday, March 31, 2019
Importance of Monsoon Forecast for India:
Indian economy is basically agriculture based, and agri business and economy depend a lot on the South West Monsoon. Agriculture contributes a major part to the GDP.
Hence, getting information and forecast of the Monsoon to the farmers and concerned departments well in advance is of prime importance. The agri industries need to plan cropping patterns and farmers need to plan purchase and storage of seeds and fertilisers.
Now, IMD issues its first SWM forecast around mid April. The April forecast indicates the likely amount of rain throughout India , on the whole, and does not detail its distribution region wise.
A forecast of regional distribution is necessary for water management and reservoir capacity storage.
The second forecast and rain estimate is issued in June. By that time, sowing is already complete, and an adverse situation could be disastrous. Saving water stressed seedlings becomes a priority with urgent irrigation. One Fourth of the SWM is over by then.
Vagaries' Views:
The SWM forecast should be issued earliest by beginning April. It could be made by analysing the weather parameters developing as on that date in early April, and subsequently monitor the developments as they happen and issue comments on how the monsoon is likely to progress. The Monsoon Watch series in Vagaries begins with this concept..and charting the progress periodically, the Monsoon Watch Series indicates the +ves and the -ves in the ensuing progress.
Initially Vagaries (MW Series) forecasts only the arrival date. And that is of prime importance. A belated advance could be fore warned, and help the farmer in delaying the sowing and saving his crops. Or later in the season, a prolonged withdrawal could be bad for the crops too, and should be forecasted and informed early.
The quantum is taken up later on.
Though a proper estimate of quantum of rain and regional distribution must be estimated. If, for example, we have 120% of the normal precipitation, that is 20% excess, in say the western state of Gujarat, and say, 80% normal, or 20% deficient in another state, IMD would declare a "normal" monsoon. That is because it takes the figures from the country as a whole. This, I feel depicts a wrong picture.
The most dangerous, or risky, is the " break Monsoon" in the middle of the season. This has to be estimated and informed as correctly as possible, as it holds the key to proper crop and water planning.
In such cases the agriculture ministry must be prepared to support proper irrigation and supply in July or August.
For such fore warnings, the IMD issues a forecasted estimate by the time the Monsoon is half over.
Now, recently,The Japanese Agency for Marine Earth Science and Tech. has forecast below normal rains for Jun/July /Aug 2019, and another International Research Institute IRI at Columbia, have forecasted a near normal SWM for 2019.
Whether true or false, our Met Department should take note of this seriously, and be prepared with the necessary steps to be taken. We just cannot wait till the IMD issues its "vague" forecasts.
IMD maintains that it (SWM) cannot be forecasted so early, and that the Indian Monsoon system is too complicated. But let us understand, these foreign agencies also have a track record.
We cannot take risks with such an important event (SWM). An event that makes or breaks Indian Agriculture and Economy.
Indian economy is basically agriculture based, and agri business and economy depend a lot on the South West Monsoon. Agriculture contributes a major part to the GDP.
Hence, getting information and forecast of the Monsoon to the farmers and concerned departments well in advance is of prime importance. The agri industries need to plan cropping patterns and farmers need to plan purchase and storage of seeds and fertilisers.
Now, IMD issues its first SWM forecast around mid April. The April forecast indicates the likely amount of rain throughout India , on the whole, and does not detail its distribution region wise.
A forecast of regional distribution is necessary for water management and reservoir capacity storage.
The second forecast and rain estimate is issued in June. By that time, sowing is already complete, and an adverse situation could be disastrous. Saving water stressed seedlings becomes a priority with urgent irrigation. One Fourth of the SWM is over by then.
Vagaries' Views:
The SWM forecast should be issued earliest by beginning April. It could be made by analysing the weather parameters developing as on that date in early April, and subsequently monitor the developments as they happen and issue comments on how the monsoon is likely to progress. The Monsoon Watch series in Vagaries begins with this concept..and charting the progress periodically, the Monsoon Watch Series indicates the +ves and the -ves in the ensuing progress.
Initially Vagaries (MW Series) forecasts only the arrival date. And that is of prime importance. A belated advance could be fore warned, and help the farmer in delaying the sowing and saving his crops. Or later in the season, a prolonged withdrawal could be bad for the crops too, and should be forecasted and informed early.
The quantum is taken up later on.
Though a proper estimate of quantum of rain and regional distribution must be estimated. If, for example, we have 120% of the normal precipitation, that is 20% excess, in say the western state of Gujarat, and say, 80% normal, or 20% deficient in another state, IMD would declare a "normal" monsoon. That is because it takes the figures from the country as a whole. This, I feel depicts a wrong picture.
The most dangerous, or risky, is the " break Monsoon" in the middle of the season. This has to be estimated and informed as correctly as possible, as it holds the key to proper crop and water planning.
In such cases the agriculture ministry must be prepared to support proper irrigation and supply in July or August.
For such fore warnings, the IMD issues a forecasted estimate by the time the Monsoon is half over.
Now, recently,The Japanese Agency for Marine Earth Science and Tech. has forecast below normal rains for Jun/July /Aug 2019, and another International Research Institute IRI at Columbia, have forecasted a near normal SWM for 2019.
Whether true or false, our Met Department should take note of this seriously, and be prepared with the necessary steps to be taken. We just cannot wait till the IMD issues its "vague" forecasts.
IMD maintains that it (SWM) cannot be forecasted so early, and that the Indian Monsoon system is too complicated. But let us understand, these foreign agencies also have a track record.
We cannot take risks with such an important event (SWM). An event that makes or breaks Indian Agriculture and Economy.
Friday, March 29, 2019

Thursday, March 28, 2019

Tuesday, March 26, 2019
Posted Tuesday 26th March:
Bureau of Meteorology (Australia) & NOAA ENSO Alert System Status: 25th March 2019
The El Niño–Southern Oscillation (ENSO) is currently neutral. The Bureau's ENSO Outlook has moved to El Niño ALERT.
Tropical Pacific sea surface temperatures have touched on El Niño thresholds for the past three weeks,
Equatorial sea surface temperatures (SSTs) are above average across most of the Pacific Ocean.
The pattern of anomalous convection and winds are consistent with El Niño.
Weak El Nino conditions are likely to continue through the Northern Hemisphere spring 2019 (~80% chance) and summer (~60% chance).
The latest weekly SST departures are:
Niño 4 0.9ºC
Niño 3.4 1.1ºC
Niño 3 0.9ºC
Niño 1+2 0.2ºC
During the last four weeks, equatorial SSTs were above average in the central and east-central Pacific Ocean. SSTs were below average around Indonesia.
In the last two months, positive subsurface temperature anomalies have persisted across most of the equatorial Pacific Ocean.
Negative subsurface temperature anomalies have weakened east of 100ºW.
The ONI is based on SST departures from average in the Niño 3.4 region, and is a principal measure for monitoring, assessing, and predicting ENSO. Defined as the three-month running-mean SST departures in the Niño 3.4 region.
El Niño: characterized by a positive ONI greater than or equal to +0.5ºC. La Niña:
characterized by a negative ONI less than or equal to -0.5ºC.
By historical standards, to be classified as a full-fledged El Niño or La Niña episode, these thresholds must be exceeded for a period of at least 5 consecutive overlapping 3-month seasons. CPC considers El Niño or La Niña conditions to occur when the monthly Niño3.4 OISST departures meet or exceed +/- 0.5ºC along with consistent atmospheric features. These anomalies must also be forecasted to persist for 3 consecutive months.
The most recent ONI value (December 2018 – February 2019) is +0.8ºC.
The 30-day Southern Oscillation Index (SOI) has been steady over the past two weeks, remaining within El Niño territory. The SOI value for the 30 days to 17 March was −13.3. However, the 90-day SOI is still well within neutral territory at −5.1.
Sustained negative values of the SOI below −7 typically indicate El Niño while sustained positive values above +7 typically indicate La Niña. Values between +7 and −7 generally indicate neutral conditions.
Bureau of Meteorology (Australia) & NOAA ENSO Alert System Status: 25th March 2019
The El Niño–Southern Oscillation (ENSO) is currently neutral. The Bureau's ENSO Outlook has moved to El Niño ALERT.
Tropical Pacific sea surface temperatures have touched on El Niño thresholds for the past three weeks,
This means the chance of El Niño developing in 2019 has increased to approximately 70%, around triple the normal likelihood.
Equatorial sea surface temperatures (SSTs) are above average across most of the Pacific Ocean.
The pattern of anomalous convection and winds are consistent with El Niño.
Weak El Nino conditions are likely to continue through the Northern Hemisphere spring 2019 (~80% chance) and summer (~60% chance).
The latest weekly SST departures are:
Niño 4 0.9ºC
Niño 3.4 1.1ºC
Niño 3 0.9ºC
Niño 1+2 0.2ºC
During the last four weeks, equatorial SSTs were above average in the central and east-central Pacific Ocean. SSTs were below average around Indonesia.
In the last two months, positive subsurface temperature anomalies have persisted across most of the equatorial Pacific Ocean.
Negative subsurface temperature anomalies have weakened east of 100ºW.
The ONI is based on SST departures from average in the Niño 3.4 region, and is a principal measure for monitoring, assessing, and predicting ENSO. Defined as the three-month running-mean SST departures in the Niño 3.4 region.
El Niño: characterized by a positive ONI greater than or equal to +0.5ºC. La Niña:
characterized by a negative ONI less than or equal to -0.5ºC.
By historical standards, to be classified as a full-fledged El Niño or La Niña episode, these thresholds must be exceeded for a period of at least 5 consecutive overlapping 3-month seasons. CPC considers El Niño or La Niña conditions to occur when the monthly Niño3.4 OISST departures meet or exceed +/- 0.5ºC along with consistent atmospheric features. These anomalies must also be forecasted to persist for 3 consecutive months.
The most recent ONI value (December 2018 – February 2019) is +0.8ºC.
The 30-day Southern Oscillation Index (SOI) has been steady over the past two weeks, remaining within El Niño territory. The SOI value for the 30 days to 17 March was −13.3. However, the 90-day SOI is still well within neutral territory at −5.1.
Sustained negative values of the SOI below −7 typically indicate El Niño while sustained positive values above +7 typically indicate La Niña. Values between +7 and −7 generally indicate neutral conditions.
Monday, March 25, 2019
Posted Monday 25th March:
Severe Heat in Mumbai ! Mumbai Scruz touched 40.3c, above normal by 7c, qualifying as a "Heat Wave"
Low Humidity was observed in Scruz, with Hygrometer showing between 13%-15% as the driest period...Unusual for this coastal metropolis.
Pune was 40.2c and Mahableshwar 34c.(Check last year , same day temps ! here...)


Data compiled by Vagarian Abhijit and Map by Vagarian Tejas. Special Thanks to them
The severe temps expected to remain around 38/39c at Scruz on Tuesday, and then some relief as the day temperatures fall to around 34c from Wednesday...Convective clouding expected on Wednesday/Thursday.
Some convective thunder showers expected in South Madhya Maharashtra on Tuesday and Wednesday (Kolhapur/Solapur/Sangli/Satara/Miraj), and in N.I. Karnataka.
Severe Heat in Mumbai ! Mumbai Scruz touched 40.3c, above normal by 7c, qualifying as a "Heat Wave"
Low Humidity was observed in Scruz, with Hygrometer showing between 13%-15% as the driest period...Unusual for this coastal metropolis.
Pune was 40.2c and Mahableshwar 34c.(Check last year , same day temps ! here...)

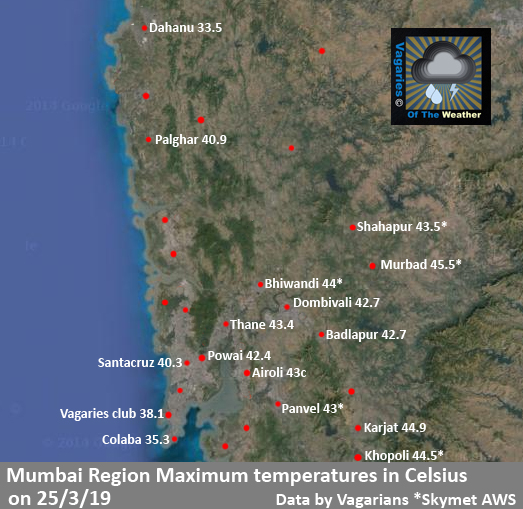
Data compiled by Vagarian Abhijit and Map by Vagarian Tejas. Special Thanks to them
The severe temps expected to remain around 38/39c at Scruz on Tuesday, and then some relief as the day temperatures fall to around 34c from Wednesday...Convective clouding expected on Wednesday/Thursday.
Some convective thunder showers expected in South Madhya Maharashtra on Tuesday and Wednesday (Kolhapur/Solapur/Sangli/Satara/Miraj), and in N.I. Karnataka.
Subscribe to:
Posts (Atom)

-
 Much Awaited Monsoon Analysis to Date from ..None Other than Our GSB..on "Stats and Analysis" Page..Just Recieved On Saturday ...
-
 Short Narration: Monday 1st/Tuesday 2nd : The heaviest rains are in Madhya Maharashtra, Marathwada, North Interior Karnataka and No...
