Weather Knowledge - 44
Peculiar Cloud Over the Caspian
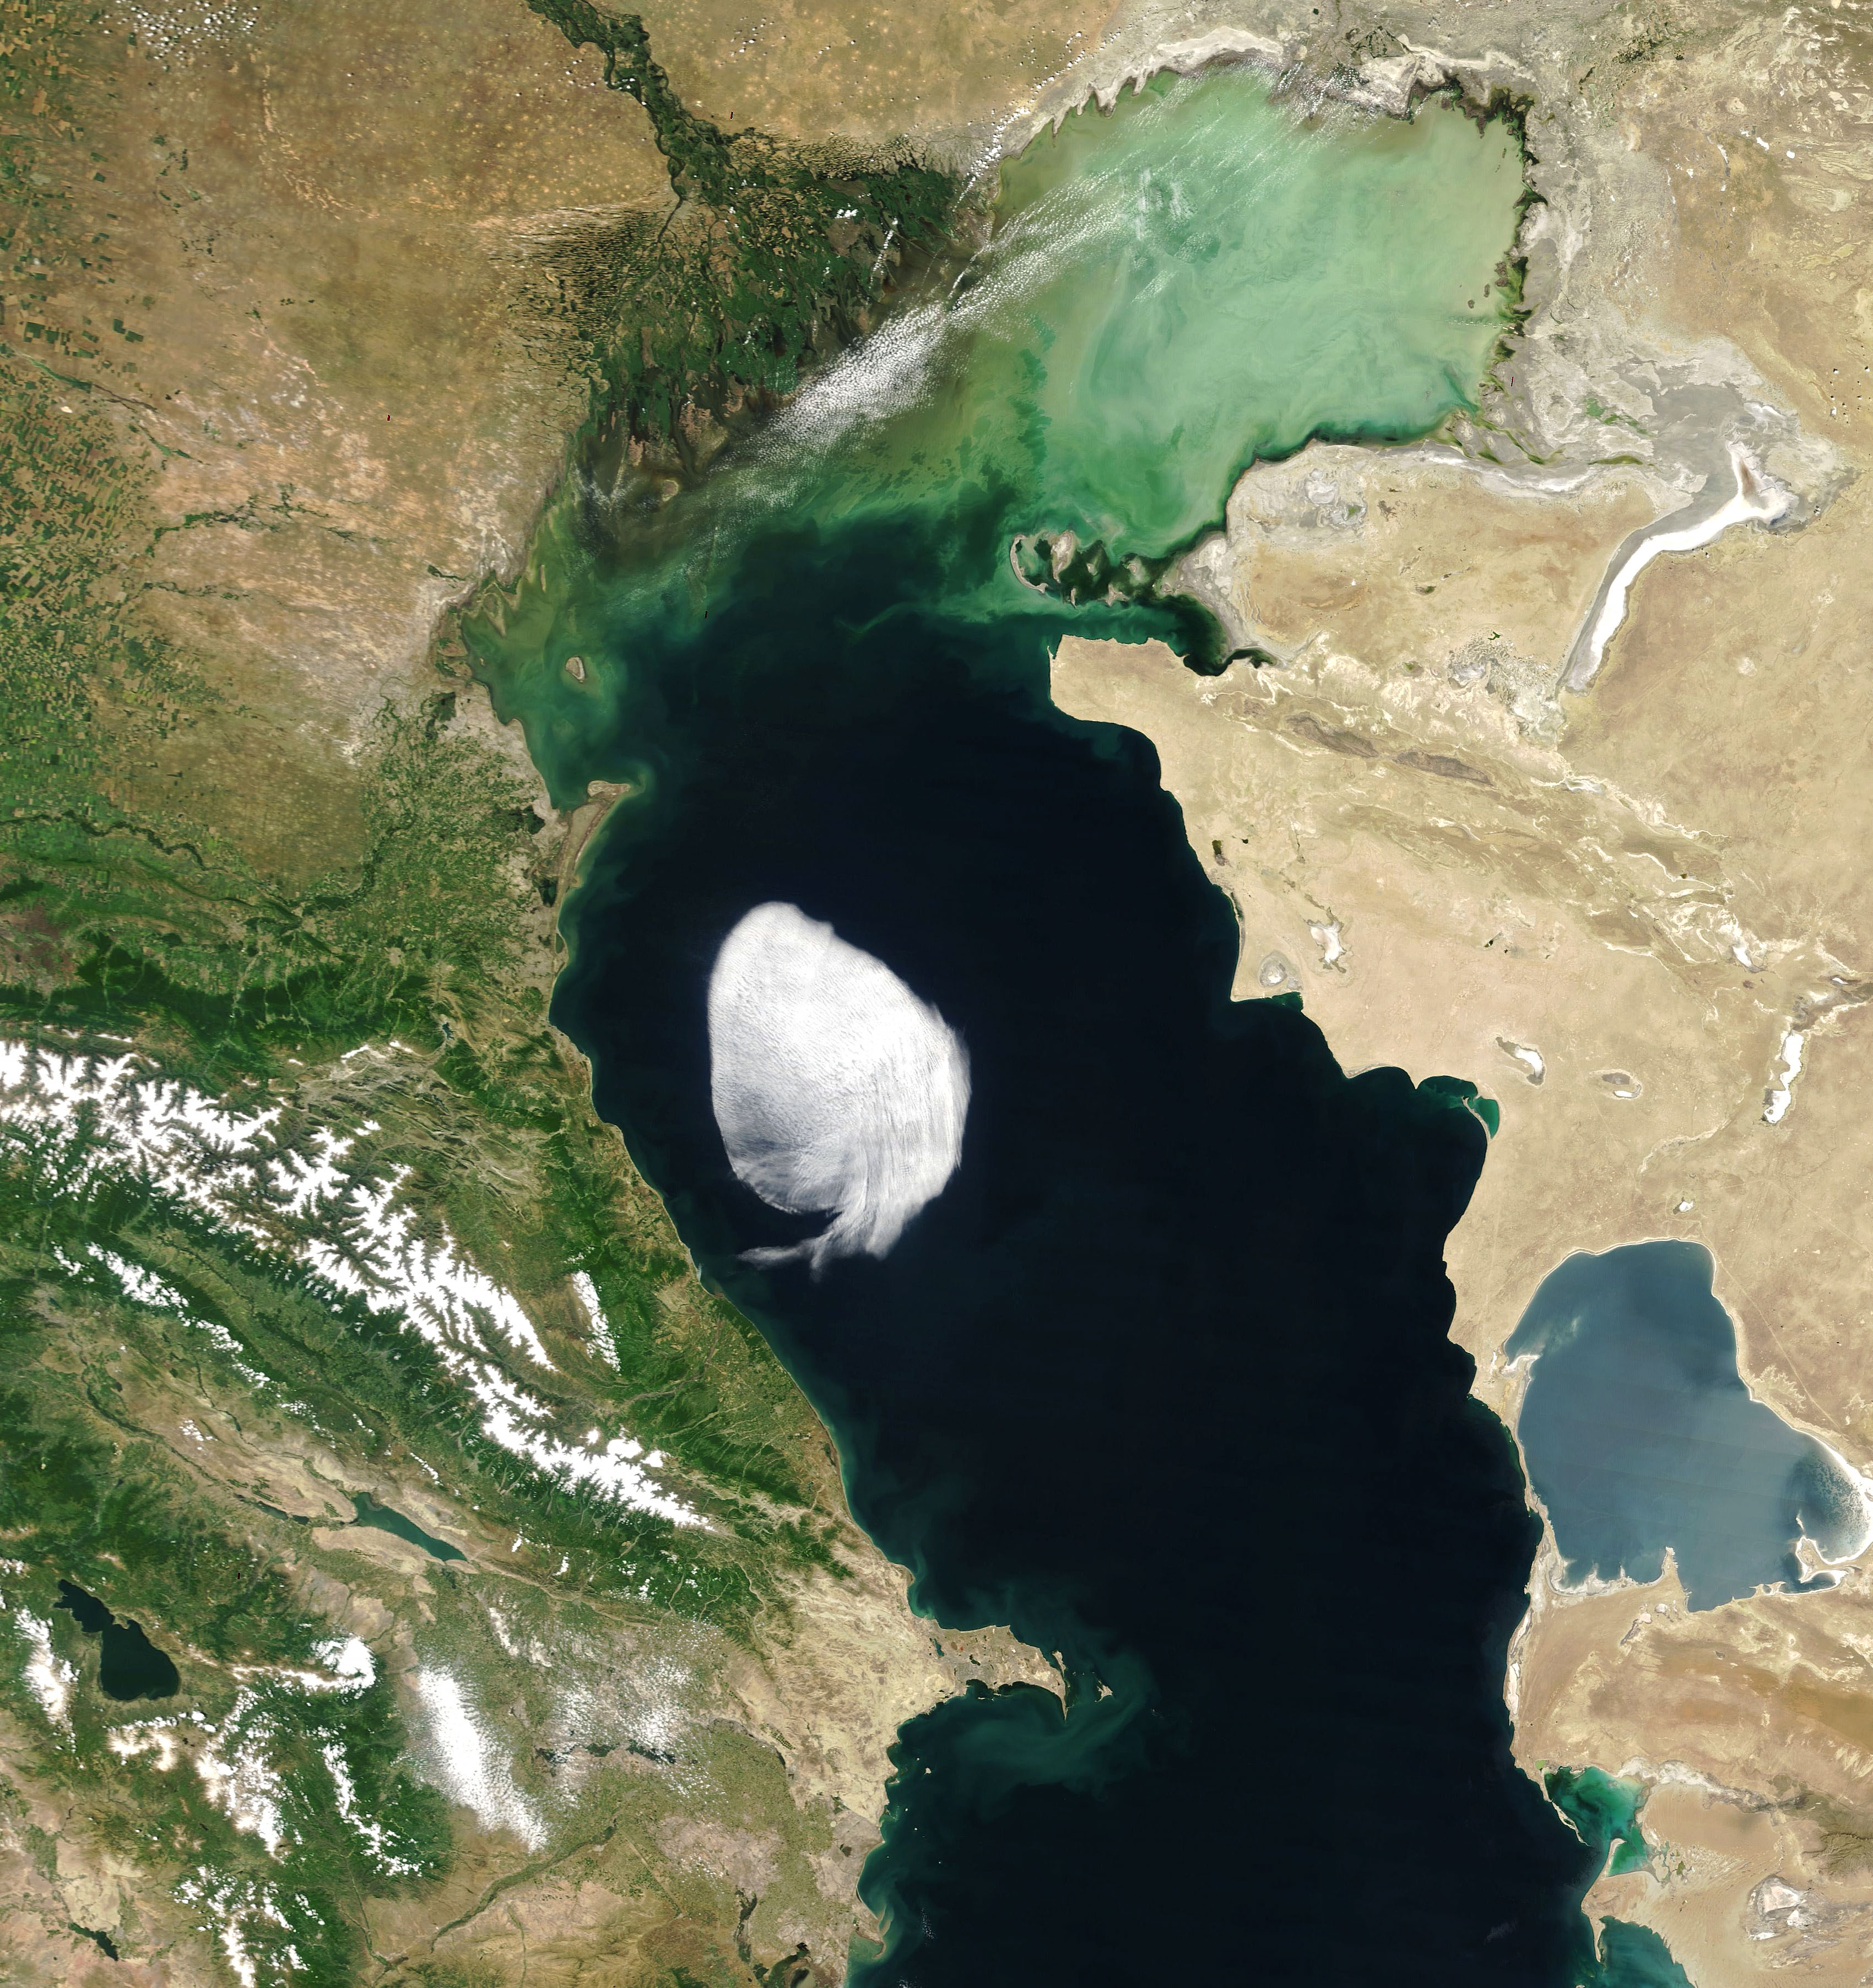
On most days, clouds hover over at least part of the Caspian Sea, the planet’s largest inland body of water. But a cloud that drifted across the Caspian on May 28, 2022, looked more peculiar than most.
The Moderate Resolution Imaging Spectroradiometer (MODIS) on NASA’s Terra satellite acquired this view on the morning of May 28. The lone cloud had well-defined edges resembling something from a cartoon, making it stand out from the more typical diffuse and dispersed cloud cover.
According to Bastiaan van Diedenhoven, an atmospheric scientist at SRON Netherlands Institute for Space Research, the cloud is a small stratocumulus. The cloud type is puffy like a cumulus cloud; cumulus is the Latin word for “heap” or “pile.” But unlike a cumulus cloud, the “heaps” in a stratocumulus cloud are clumped together, forming a widespread horizontal cloud layer. (Stratus is from a Latin verb that means “to spread out,” or “cover with a layer.”) The stratocumulus pictured here formed a layer spanning about 100 kilometers (60 miles) across.
Stratocumulus clouds form at low altitudes, generally between 600 and 2,000 meters (2,000 and 7,000 feet). This cloud was probably hovering at an altitude of about 1,500 meters (5,000 feet).
In the late morning (shown above), the cloud was poised over the central Caspian. By the afternoon it had drifted toward the northwest and hugged the coast of Makhachkala, Russia, along a low-lying plain near the foothills of the Caucasus Mountains. According to van Diedenhoven, the cloud could have formed when warm, dry air—possibly from the Balkans—encountered colder, moist air over the Caspian. It then drifted across the sea and dissipated when it reached land.
The scenario also explains the cloud’s well-defined edges. “Sharp edges are often formed when dry, warm air coming from land collides with colder moist air over the ocean, and the cloud forms at that boundary,” van Diedenhoven said. “You often see this off the west coast of Africa, but at much larger scales.”
NASA Earth Observatory image by Joshua Stevens, using MODIS data from NASA EOSDIS LANCE and GIBS/Worldview. Story by Kathryn Hansen.
Weather Knowledge - 43
Research: Pacific storm clouds strengthened 2021 Northwest heat wave
Weather Knowledge - 42
Red Sprites Generated By Hurricane Mathew
Taken by Frankie Lucena on October 1, 2016 @ Cabo Rojo,Puerto Rico
These red sprites were captured last night when Hurricane Mathew was near Aruba and the northern tip of Colombia. I used a Canon EOS T3 camera with no IR filter and a 50mm lens at F/1.8 for 1 second at iso 6400.
Sprites are a strange and beautiful form of lightning that shoot up from the tops of electrical storms. They reach all the way up to the edge of space alongside meteors, auroras, and noctilucent clouds. Some researchers believe cosmic rays help trigger sprites, making them a true space weather phenomenon.
Seeing sprites above a hurricane is rare. Many hurricanes don't even have regular lightning because the storms lack a key ingredient for electrical activity: vertical winds. (For more information read the Science@NASA article "Electric Hurricanes.") But Matthew is not a typical hurricane. It's one of the most powerful in recent years, briefly reaching Category 5 at about the time Lucena photographed the sprites. Perhaps extra-strong winds in the vicinity of the storm set the stage for upward-reaching bolts.
Weather Knowledge - 41
Here is a picture taken by Darlisa on Friday (looking north, west is to the left).

From Cliff Mass Weather Blog
Weather Knowledge - 40
Assessing Lightning Risk in South Asia
In August 2021, a wedding in northwestern Bangladesh took a tragic turn when lightning struck and killed 17 guests along the Padma River during a downpour. Though such mass casualty incidents are rare, fatal lightning strikes in Bangladesh and nearby Nepal are not.
Hundreds of people lose their lives to lightning in these two countries each year, and hundreds more are injured. Due to sharp increases in lightning deaths and injuries in Bangladesh and Nepal in recent years compared to the past few decades, the problem is getting more attention from both scientists and government officials. As awareness of lightning dangers grow, satellite observations and ground-based lightning networks are playing key roles in sizing up the extent of the problem and helping people formulate strategies to minimize the risks.
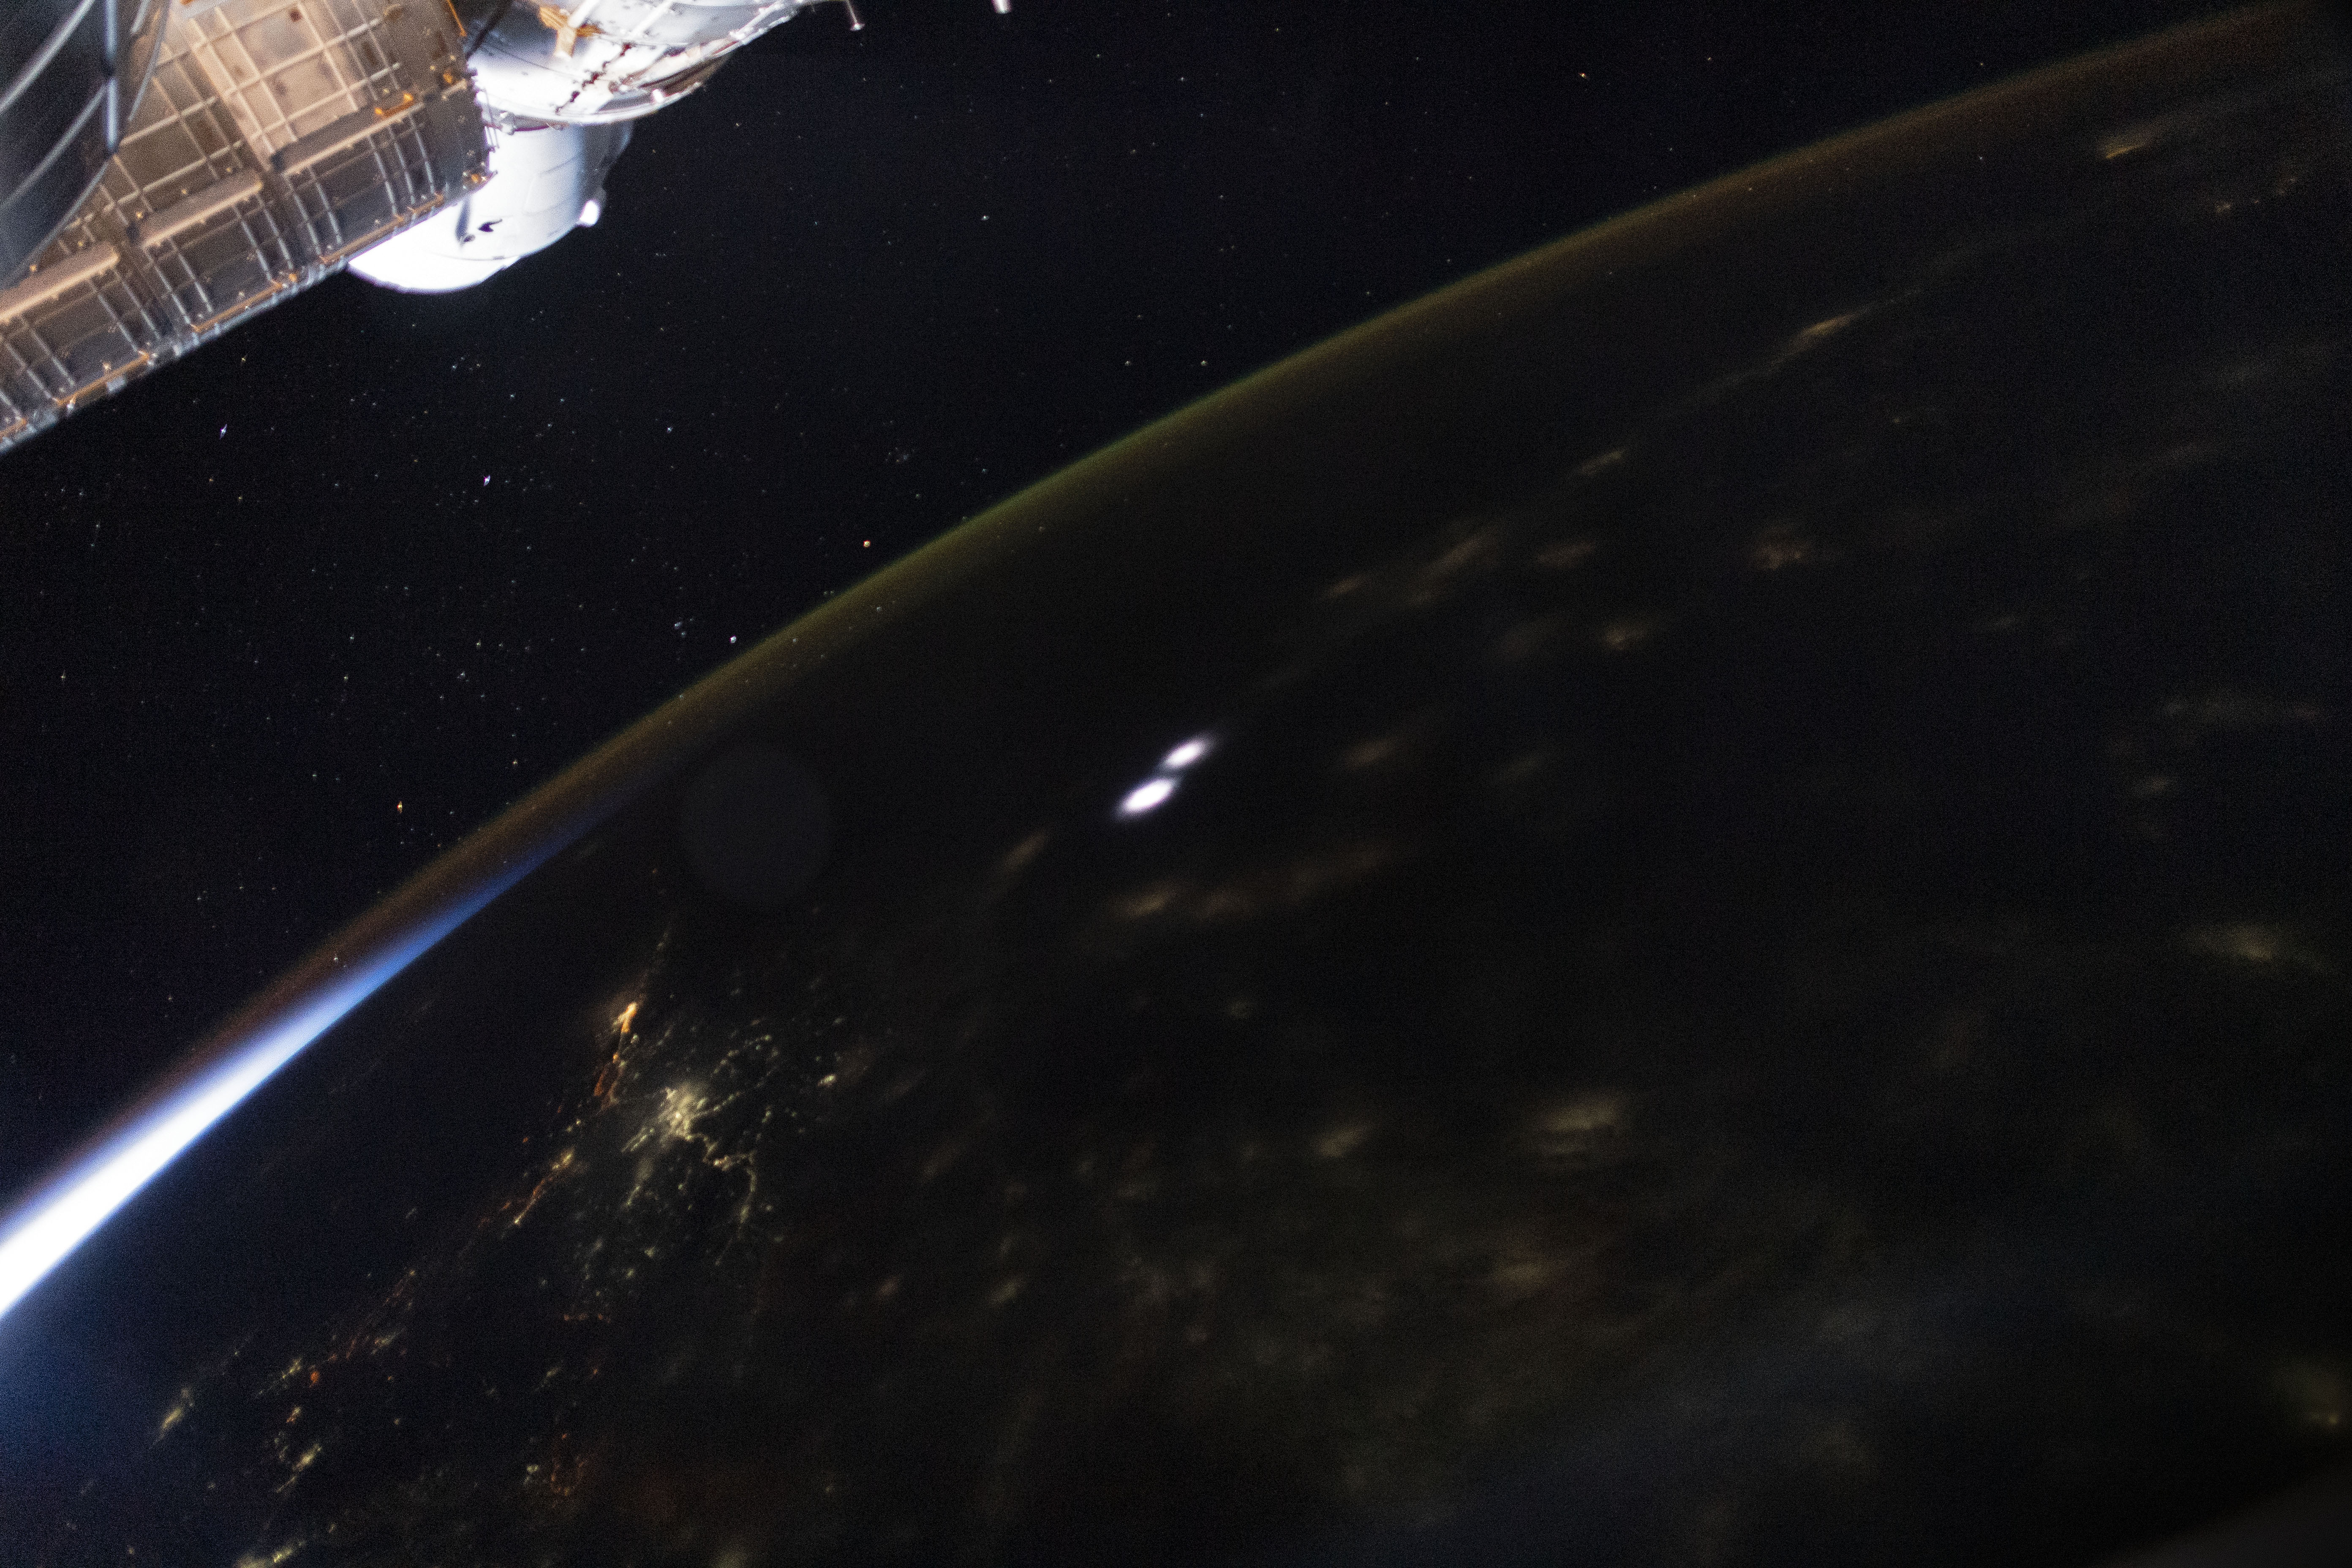
The number of reported lightning deaths and injuries in Bangladesh has increased from dozens of deaths per year in the 1990s to more than 300 per year now. Trends are more difficult to determine in Nepal due to a lack of long-term data, but one recent study estimated about 100 people are killed by lightning there each year. For comparison, lightning kills about 17 people per year in the United States, a country with more than 10 times as many people as Nepal. The photograph below, taken by an astronaut on the International Space Station, shows lightning flashing over Nepal in 2021.
Lightning experts cite a variety of reasons for the apparent increases in deadly strikes, including population growth, better reporting, and increasing storminess due to climate change. Though the cause is not clear, the timing is quite clear.
“The frequency of lightning is highest in Bangladesh during the pre-monsoon period from mid-April to June,” said Ashraf Dewan, a remote sensing scientist at Curtin University. Using observations from NASA’s Lightning Imaging Sensor (LIS), he found that 69 percent of the lightning strikes in Bangladesh occur during the period before the heaviest seasonal rains set in. And lightning flashes were particularly common in the morning. The LIS instrument flew on NASA’s Tropical Rainfall Measuring Mission (TRMM) satellite from 1997 to 2015, and a duplicate sensor has operated on the International Space Station since 2017.
“Bangladesh has more lightning from sunrise to midday than anywhere else in the world,” added Ron Holle, a meteorologist with the National Lightning Safety Council. “Unfortunately, that is when people are farming in huge numbers across the country.” Holle and Dewan worked together on a study of ground-based lightning data from the Global Lightning Detection Network that documented a large number of lightning deaths among Bangladeshi farmworkers.
Dewan and other colleagues have been analyzing decades of satellite observations from LIS as well as data from ground-based lightning networks to map lightning patterns in Bangladesh. Other researchers have done similar mapping for Nepal.
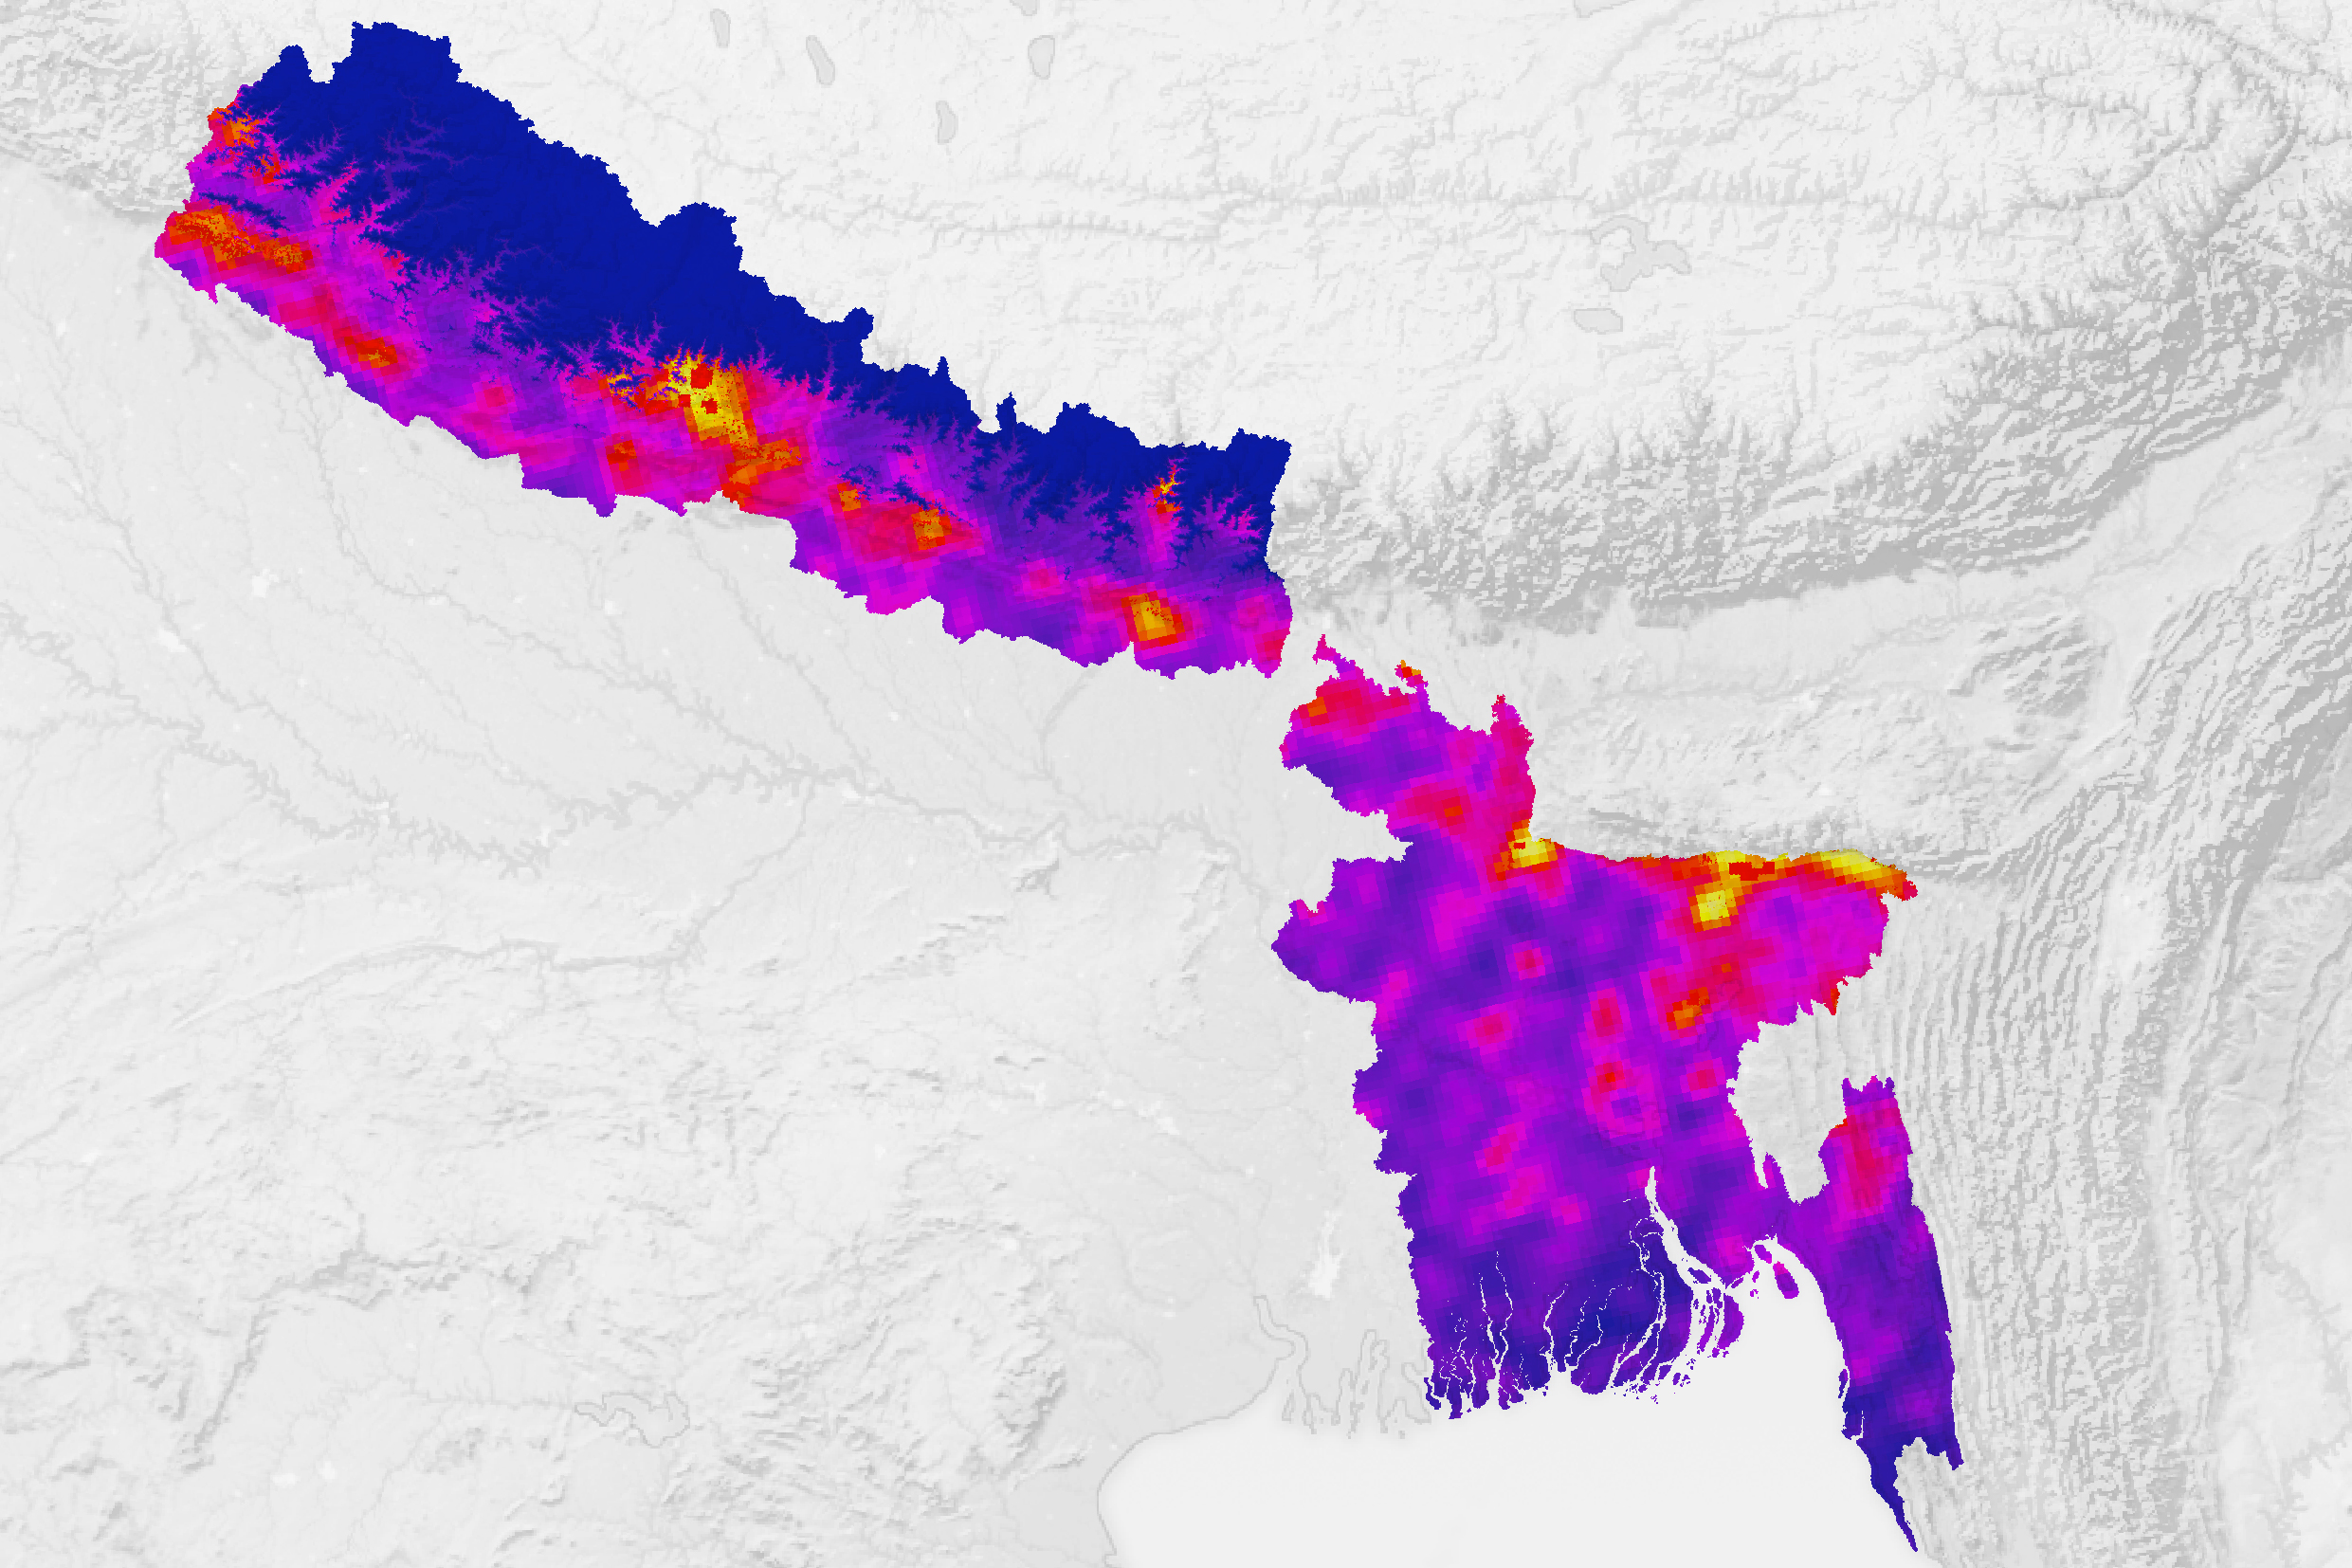
One team of researchers in the DEVELOP program at NASA’s Marshall Space Flight Center worked to turn LIS data into a product tailored to save lives. The team integrated maps of lightning flash density together with data on land elevation, population density, and socioeconomic vulnerability to lightning (including housing conditions and employment type). One of their lightning risk maps is shown at the top of the page; areas with the highest risk are depicted in yellow.
“Our goal was to map where lightning posed the highest risk to people—not just where the most lightning flashes occur,” explained Essence Raphael, a member of the DEVELOP team and a research associate at the University of Alabama in Huntsville. “That’s the kind of information people who develop safety interventions and educational campaigns can use to target their efforts most effectively.”
Flash density relative to population density was critical for defining the high-risk areas, explained Patrick Galtin, a lightning researcher at NASA Marshall. Though the number of lightning strikes in both countries is similar, the risk is higher in Bangladesh due to its higher population density.
Terrain also plays an important role in defining high-risk areas. Dry air in the higher elevations of northern Nepal prevents storms from forming. However, in lower-elevation areas along the country's southern border, warm, moist winds from the Bay of Bengal collide with cool air from the north to produce towering cumulonimbus clouds and extreme lightning.
Likewise in Bangladesh, the northeastern part of the country has a higher risk because the area is buffeted by moisture-laden winds that run into hilly terrain, which promotes convection and storm development. It is also an area with large numbers of farm and other outdoor workers in harm’s way.
After creating the maps, the DEVELOP team shared them with meteorologists at the Bangladesh Meteorological Agency and Nepal’s Department of Hydrology and Meteorology. Targeted information about lightning risk could be used to help advance ongoing lightning safety initiatives, noted Raphael. Such efforts include building early warning systems, constructing lightning shelters, and conducting public education campaigns.
Given the increasing risks, Dewan has some practical advice for people in the two countries. “If you can, get inside a large building with grounded wiring and plumbing or a fully-enclosed, metal-topped vehicle during thunderstorms. Don’t shelter under isolated trees or on high ground if you are stuck outside,” he urged. “Stay away from water and open spaces.”
NASA Earth Observatory image by Lauren Dauphin using data from NASA DEVELOP (Raphael et al.) Astronaut photograph ISS065-E-386846 was acquired on September 14, 2021, with a Nikon D5 digital camera using a focal length of 24 millimeters. Story by Adam Voiland.
Weather Knowledge- 39

Weather Knowledge - 38

Weather Knowledge - 37
The Tonga Volcano Affects the Weather and Water of the Pacific Northwest
Yesterday, around 0400 UTC 15 January (8 PM PST 14 January), there was a massive, explosive eruption near Tonga, in the southern tropical Pacific, about 5642 miles from Seattle (see map).

The volcano was clearly evident in satellite imagery from the massive ash cloud (see below, about 1-h after the eruption)

The explosive eruption created shock waves in the atmosphere (pressure waves) that rapidly propagated away. These waves are evident in some infrared (water vapor channel) imagery as concentric rings (shown below).

The oceanic eruption also pushed away a massive amount of water, which created a tsunami on nearby islands (such as Tonga) and deep water waves that moved away at the speed of a jet plane, reaching the West Coast this morning. This is why some local tsunami warnings went out this AM.
The Pressure Wave Reaches the Northwest
Local barometers indicated a well-defined pressure wave passing over our region around 4:30 AM this morning. Here in Seattle, the University of Washington barometer showed the feature, with an amplitude of roughly 2 hPa (2 mb). The arrow indicates the feature. Very impressive.

So it took about eight hours and 30 minutes to go about 5643 miles--thus a speed around 664 miles per hour.
The water wave moves slower, around 400 mph (and occasionally approaching 500 mph)....so a later arrival was expected. Thus, at Neah Bay, at the entrance to the Strait of Juan de Fuca, the water wave arrived around 9 AM (17:00 UTC as shown on the chart), as indicated by the waviness in the water level after that time. The amplitude of the variation is around 2 feet.From Cliff Mass Weather Blog
Yesterday, around 0400 UTC 15 January (8 PM PST 14 January), there was a massive, explosive eruption near Tonga, in the southern tropical Pacific, about 5642 miles from Seattle (see map).
The volcano was clearly evident in satellite imagery from the massive ash cloud (see below, about 1-h after the eruption)
The Pressure Wave Reaches the Northwest
Local barometers indicated a well-defined pressure wave passing over our region around 4:30 AM this morning. Here in Seattle, the University of Washington barometer showed the feature, with an amplitude of roughly 2 hPa (2 mb). The arrow indicates the feature. Very impressive.
So it took about eight hours and 30 minutes to go about 5643 miles--thus a speed around 664 miles per hour.
Pressure spikes from around the globe due to the eruption


Weather Knowledge-36
FAQ...What is Coldest time of the day
Lowest temperature is just after sunrise
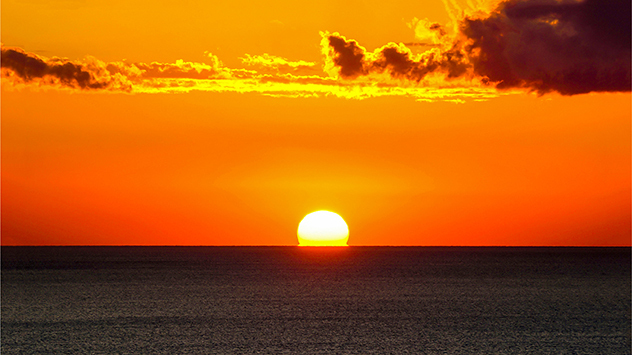
The coldest time of the day is normally about plus/minus 15 minutes of sunrise.
A lot of people ask this, because it seems logical that the coldest time should be in the middle of the night. However, all through the night the ground is losing heat and the air is steadily getting colder.
When the sun rises over the horizon, its first rays are very weak. and there is still more heat being lost then is being received.
After around 15 minutes, the sun is strong enough to add a little warmth and the temperatures can start to rise.
O f course there are plenty of things which can cause the temperature to change during the day. Warm air can drift in from another area or clouds/rain can drag the temperature up or down. If sky is clear and there is no cloud or wind draft affecting the weather, the coldest time of the day will be just after dawn.
Weather Knowledge -35
What is UV index? An expert explains what it means and how it’s calculated
Written by Sarah Loughran
You’ve probably seen the UV index in the day’s weather forecast, and you know it tells you when you need to cover up and wear sunscreen. But where does that number come from? We produce it at the Australian Radiation Protection and Nuclear Safety Agency (ARPANSA). Australia has one of the highest rates of skin cancer in the world, accounting for about 80 per cent of cancers diagnosed in Australia each year. Most skin cancers are caused by exposure to UV radiation from the sun.
What is the UV index?
The UV index tells you how much ultraviolet radiation is around at ground level on a given day, and its potential to harm your skin. UV radiation is a component of sunlight that can cause tanning and sunburn in the short term. In the longer term, too much exposure to UV can cause cataracts and skin cancer.
In 2002, the World Health Organisation devised the UV index in an effort to make people around the world more aware of the risks.
The index boils down several factors into a single number that gives you an idea of how careful you need to be in the sun. A score of 1 or 2 is low, 3 to 5 is moderate, 6 or 7 is high, 8 to 10 is very high, and 11 and above is extreme.
What is UV radiation?
The Sun showers Earth with light at a huge spectrum of different wavelengths, and each wavelength can have a slightly different effect on human skin. An important part of the spectrum is ultraviolet or UV radiation: light with wavelengths too short for our eyes to see, from around 400 nanometres to 10 nanometres.
There are two important kinds of UV radiation: UV-A, with wavelengths from 400 to 315 nanometres, and UV-B with wavelengths from 315 to 280 nanometres. (Shorter wavelengths are called UV-C, but are mainly blocked by the atmosphere so we don’t need to worry about it.)
How is the UV index calculated?
The UV index takes into account how much UV radiation of different wavelengths is around and how each of those wavelengths affects our skin.
ARPANSA has a network of sensors around Australia measuring sunlight at different wavelengths to determine the UV index, with the information available online in real time. This data is combined with other information about location, cloud cover and atmospheric conditions to produce maps and forecasts of the UV index for the whole country.
How are UV levels different around the world?
The UV index you see reported is usually the daily maximum — that’s the highest it will be all day. How high it gets depends on lots of factors, including your location, the time of year, the amount of cloud cover, and ozone and pollution in the atmosphere.
The index tends to be higher closer to the Equator and at high altitudes, as the sunlight has to pass through less air before it reaches the ground. People often experience the sun in Australia as particularly harsh, compared with places in North America or Europe.
In a British summer, for example, the maximum UV index might be between 6 and 8. In an Australian summer it can range from 10 to 14.
There are a few reasons for this. One is that Australia’s cities are closer to the Equator than many big cities in Europe and North America. Another is that Earth is very slightly closer to the Sun in the southern hemisphere’s summer than the northern summer, meaning the sunlight is a few percent brighter. A third reason is the ‘hole’ in the ozone layer. The layer of ozone in the upper atmosphere, which absorbs some UV-B, is thinner towards the South Pole. This was caused by the use of chemicals called chlorofluorocarbons or CFCs, and it has been improving since they were banned by an international agreement in 1987. And finally, the air in Australia generally has less smoke, dust and other small particle pollution than many places in the northern hemisphere. While this makes the air nicer to breathe, pollution does absorb or block some UV radiation.
Is UV changing over time?
We know UV levels have increased in recent decades. In Australia, a study in 2011 found the average UV index had increased by 2 to 6 per cent between the 1970s and the period 1990 to 2009, due to depletion of the ozone layer. A NASA study found similar results for 1979 to 2008. It’s harder to say what will happen in the future, as there are several uncertain factors.
We expect the ozone layer to slowly recover from the impact of CFCs, which is likely to reduce UV levels. However, we also expect less fossil fuel will be burned, which would mean less air pollution and higher UV levels.
On the flip side, we may also have more bushfires due to climate change, which would mean more air pollution and lower UV. Clouds are also likely to behave differently due to climate change, but we’re not sure exactly how. Researchers in Japan found reductions in clouds and tiny particles in the air are expected to have a bigger impact than the recovery of the ozone layer, which would mean UV levels are likely to go up overall.


No comments:
Post a Comment