Weather Knowledge - 52
Western Disturbances ...by Vag. Shreyas Dhavale
Being in the tropics, broadly speaking, the winter over India is characterized by cool and dry weather. We all are aware that it snows over Himalayas in winter. For snowfall to occur, the presence of clouds is necessary. But where do these clouds come from after the monsoon has withdrawn from the subcontinent? The reason for this winter precipitation which is in the form of rain/snow over Himalayas and rain over parts of north Indian plains is the Western Disturbances (WDs).
What is a Western Disturbance (WD)?
The name itself suggests that it is a disturbance coming from the west i.e. the movement is mainly from west to east. Disturbance implies that it is characterized by disturbed weather which can be in the form of rain, snow, cloudiness and reduced pressure. WD is an extra-tropical system which means that it is a system which is observed beyond the tropics or beyond 23.5°N latitude.
WDs are sometimes also referred to as mid-latitude frontal systems in scientific terms. A Front is a boundary between two different air masses. WDs can be said to be a part of extra-tropical cyclones originating as mid-latitude frontal systems. These systems develop due to imbalance between the cold polar air and the warm tropical air. This difference is most pronounced during winters over mid-latitudes and hence the systems are strongest in this season. The stronger the north-south temperature gradient, the stronger a western disturbance can get provided additional conditions like moisture availability are satisfied.
Western Disturbances usually originate over the Mediterranean Sea or sometimes from as far as the Atlantic Ocean (in few cases, WDs are seen forming over the Caspian Sea as well). They travel eastwards across Iraq, Iran, Afghanistan and Pakistan, and finally enter north India and move away further eastwards. They ride over the subtropical westerly jet stream which is present at 200 mb pressure level (equivalent to 11.5-12 km altitude). A jet stream is a river-like current of air circulating across the globe at upper levels of the troposphere. A trough or dip in the jet stream is an indication of the presence of a disturbance. This trough in the jet stream can be seen from the weather charts as shown in figure 3.
Figure 1 : WD approaching India from the west
Figure 2: WD affecting north India
Figure 3: Trough in westerly jet at 200 mb level (indicated by red line)

Over North India, increased cloudiness and rise in the minimum temperature is an indication of an approaching western disturbance. At the surface and lower levels (up to around 700 mb i.e. approx. 3km altitude) Winds turn southerly to southeasterly in the northern plains when a WD approaches. Initially high level clouds can be seen, followed by mid-level and then low clouds as well as thunderclouds which give rain (or at times even hail) over the plains of Punjab, Haryana, Rajasthan, west UP, Delhi-NCR and the foothills of Himalayas. The mid and upper reaches of Himalayas receive snowfall. To the south of the WD, there is often the presence of an induced low pressure area or a cyclonic circulation (anticlockwise rotation of winds) which is instrumental in bringing precipitation to the plains of north India. After moving eastwards from the Mediterranean, the main source of moisture for WDs is the Persian Gulf/Gulf of Oman and the Arabian Sea. The cloudy and rainy conditions over north India due to WDs result in the maximum temperatures remaining significantly below normal.
After the passage of a WD, the wind direction changes and cold northerly to northwesterly winds start blowing over the north Indian plains. The cold winds coupled with the availability of moisture in the air immediately after the passage of a WD often leads to the formation of widespread fog over the plains of north India. Such fog events are at times spread across hundreds of kilometers and very dense fog is observed up to eastern Gangetic plains along with northwest India. If dense fog persists throughout the day, then the maximum temperature over those regions remains significantly below normal leading to cold-day like conditions.
The blowing of cold northerlies after the passage of WD drops the minimum temperature across much of northern, eastern and central India and can at times lead to cold wave like conditions.
Thus, to summarize, the movement of a western disturbance across north India causes an inflow of warm and comparatively moist air from relatively southern latitudes ahead of the disturbance and of cold and dry air from relatively northern latitudes in the rare of the disturbance (as indicated in the illustration below). Occasionally, in the rear of a western disturbance there is an influx of markedly cold and dry air from much higher latitudes into northwest India and the adjoining regions, which spreads to other parts of the subcontinent as cold wave. Cold and dry winter like conditions return to most of the country until the weather is changed again by another approaching western disturbance.
Figure 4: Winds at 850 mb when WD is approaching
Figure 5: Winds at 700 mb when WD is approaching Cyclonic circulation WD Direction of movement

Figure 6: Winds at 850 mb after WD has passed
Figure 7: Winds at 700 mb after WD has passed

Usefulness and adverse impacts of WDs:
The precipitation associated with western disturbances helps in the replenishment of Himalayan glaciers and in maintaining the snow cover. The snow over Himalayas is the source of water for the numerous perennial rivers flowing downstream towards northern plains of the country. In addition, the rainfall associated with WDs helps in retaining soil moisture as well as in the growth of rabi crops like wheat in Punjab, Haryana and UP. The rain also helps in cleansing the air of pollutants over the Delhi-NCR region and temporarily helps in improving the air quality. The continuous period of cold and dry weather is broken with the arrival of a WD.
However, very strong WDs with the westerly trough dipping to southern latitudes of Gujarat, Maharashtra and MP can cause widespread rain in these areas which can potentially damage the rabi crops in these regions. Also, strong WDs can lead to intense precipitation and hail which can be detrimental for crops. Late season WDs occurring in May-June can result in slight cooling of the northern plains of the Indian subcontinent and may delay the northward advancement of the Southwest Monsoon over the subcontinent. Also, if a WD approaches simultaneously with the advancing monsoon over north India, it can result in some areas receiving very heavy rain (one example of this is the Uttarakhand floods of June 2013).
Weather Knowledge - 51
The strongest jet stream ever observed by a radiosonde? 259 mph ( 416.8 Kmph) near Yanongo Japan in 2004.
18th February ..2024 :So how unusual were the winds, say over Washington, DC during this event?
There is a radiosonde (balloon-launched weather station) at Sterling, Virginia (Dulles Airport), just to the west of Washington, DC. On Sunday morning, the ballow measured a speed of 218 knots from the west.
Impressive. But how unusual? Below is a plot (red line) of the daily 250-hPa (about 33,000 ft) strongest winds at that location for a period from 1950 to today. The star indicates the Dulles winds on Sunday.
That morning, there were the second strongest winds at that level in over 70 years! That is very, very impressive.

Weather Knowledge -50
A heat dome is a meteorological phenomenon characterized by a dome-shaped area of high pressure in the atmosphere that traps hot air beneath it. This can lead to prolonged periods of excessively hot weather, often resulting in heatwaves. The sinking air within the dome compresses and heats up, causing temperatures to soar. Heat domes can lead to dangerous heat conditions, with high temperatures and, in some cases, heat-related health risks. They are a result of complex atmospheric patterns and are associated with extreme heat events.
Weather Knowledge - 49
How and Why of Cloudbursts:

A lot is being mentioned recently about "Cloudbursts " in our Hill States...which are causing landslides and loss of lives and property.
{ Note: Vagarians previously mentioned several times that it is not "Climate Change" which is causing casualties in HP, Uttarakhand
| Duration | Rainfall | Location | Date |
|---|---|---|---|
| 1 minute | 1.5 inches (38.10 mm) | Basse-Terre, Guadeloupe | 26 November 1972 |
| 5.5 minutes | 2.43 inches (61.72 mm) | Port Bell, Panama | 29 November 1911 |
| 15 minutes | 7.8 inches (198.12 mm) | Plumb Point, Jamaica | 12 May 1916 |
| 20 minutes | 8.1 inches (205.74 mm) | Curtea de Argeș, Romania | 7 July 1947 |
| 40 minutes | 9.25 inches (234.95 mm) | Guinea, Virginia, United States | 24 August 1906 |
| 1 hour | 9.84 inches (250 mm) | Leh, Ladakh, India | August 5, 2010 |
| 1 hour | 5.67 inches (144 mm) | Pune, Maharashtra, India | September 29, 2010 |
| 1.5 hours | 7.15 inches (182 mm) | Pune, Maharashtra, India | October 4, 2010 |
| 2 hours | 3.94 inches (100 mm) | Pithoragarh, Uttarakhand, India | July 1, 2016 |
Weather Knowledge -48
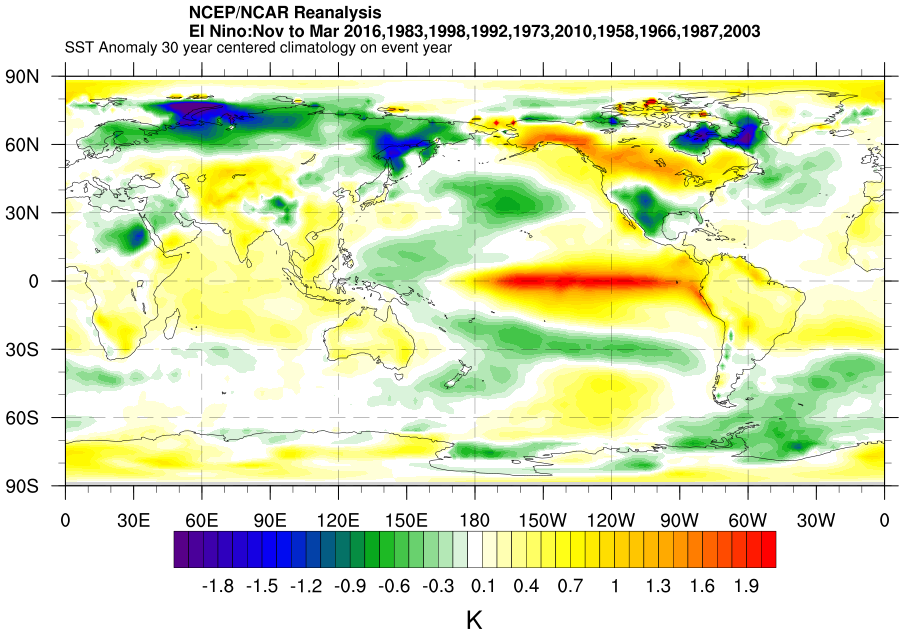
Understanding the Pacific - an article on El Nino and La Nina
There has been a lot of discussion on the possibility of El Nino this year, and chances of it affecting our Southwest Monsoon.
Let us first understand what happens in the Pacific Ocean that leads to an El Nino, and we will then look at the scenario for this year.
The waters of the Pacific Ocean near the equator are warmer in the west Pacific (near Indonesia/Philippines), and cooler in the east Pacific (near South America).
Part of the warm water in the west Pacific sinks down (a process called downwelling), while cooler waters from below the surface rise up in the east Pacific (a process called upwelling). This is one reason why the west Pacific is warmer than the east Pacific.
The winds are mainly easterly i.e., blowing from east to west in the equatorial and tropical Pacific almost throughout the year. This is one more reason why the warm water in the tropical Pacific is pushed west along the surface and gets piled up in the west Pacific.
El Nino - A condition wherein the water in the eastern equatorial Pacific is warmer than normal i.e., the sea surface temperature anomalies are positive (anomalously warm).
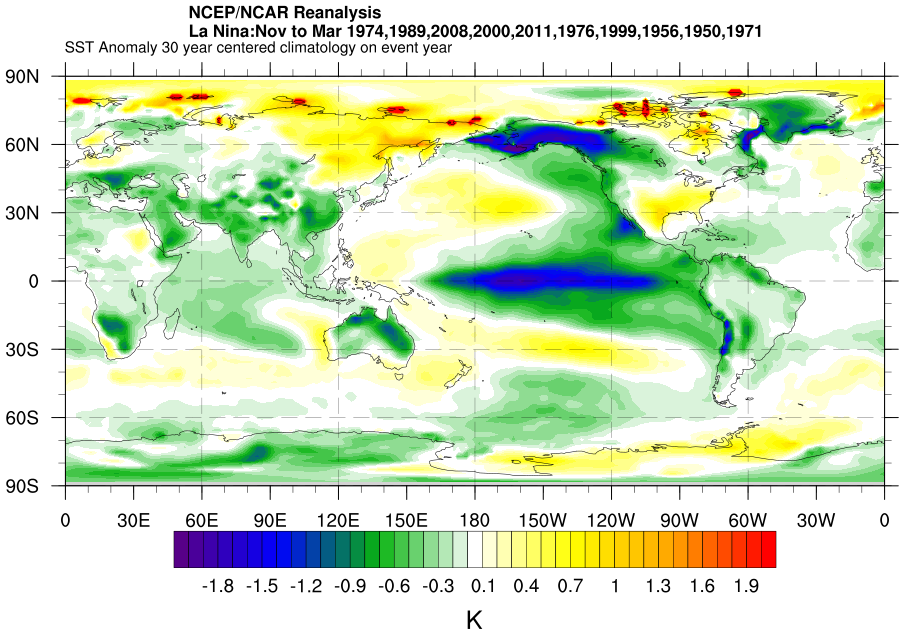
- We have been in La Nina conditions for 3 consecutive years. This has caused huge amount of warm water to pile up in the west Pacific, which has sunk below the surface.
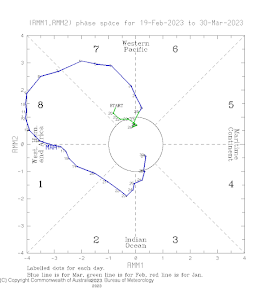
- The westerly wind burst associated with this MJO has helped this water to start shifting eastwards below the surface (see the animation below). The longitudes on the x-axis denote the boundaries of the Pacific Ocean.


The forecasts issued during February, March or April for El Nino or La Nina from most weather and climate models are not very reliable. This low accuracy in the forecasts is termed as the Spring Predictability barrier and has been a big challenge for seasonal predictions. The forecasts issued from/after May for El Nino and La Nina are more reliable.
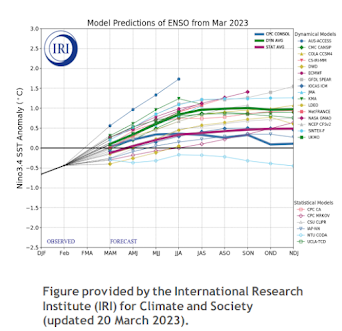
- The model consensus at this point, is predicting an El Nino to start developing from the second half of this year, and peaking by year-end.


OK, so it’s bad, but not that bad: in spite of the climate crisis, there’s still plenty of good news
Too hot to be this cold?
The polar vortex hypothesis
There is no doubt about it: extreme cold weather events continue to occur. The latest example is the winter storm that swept across much of the United States during Christmas 2022, with temperatures reaching minus 50 degrees Celsius, high winds, and heavy snowfall.
The scientific community attributes these sudden and intense waves of cold to ripples in the polar vortex, a current of cold air that generally rotates stably over the Earth's poles. It may happen that these eddies begin to undulate, bringing cold air even to mid-latitudes and thus causing the frost waves.
Again, however, the IPCC tells us that there is no scientific evidence linking climate change to an increase in polar vortex ripples. On the contrary, all the evidence indicates that the decrease in global cold extremes is also affecting the mid-latitudes.
So, in conclusion, while it is scientifically proven that episodes such as the Christmas 2022 winter storm are related to polar vortex ripples, we must consider that such events are to be regarded as exceptional episodes occurring within a rapidly warming global climate context.
Bizarre Clouds Seen Over Puget Sound,...Cliff Mass Weather Blog.
During the past day, I have received several emails and pictures of a strange cloud feature seen from roughly 4 PM to 5:30 PM on Thursday. Let me show you.
Theresa Verway took this picture from Shilshoe Beach in Seattle around 4:12 PM


Eric Luis
2010 Russia Heat Wave
Date: July - August, 2010
Highest Temperature: >100 °F
Deaths: 56,000
In 2010, Russia experienced the most extreme heat wave in more than a century. Temperatures exceeded 100 degrees Fahrenheit throughout the summer, which is exceedingly rare in Russia. The heat wave wreaked havoc on the nation, including destroying a large amount of the country's agricultural stock. Wildfires were also a massive problem, and smoke inhalation was a major factor in the massive death toll. Scientists predict that, as global temperatures rise, northern countries like Russia will be at a far greater risk of heat waves and wildfires than at any other point in recorded history. However, studies indicate the 2010 heat wave itself was likely due to natural variability rather than human-caused climate change.
 Photo: Unknown / Wikimedia Commons / Public domain
Date: June - July, 1901
Highest Temperature: 109 °F
Deaths: 9,500
Before the infamous Dust Bowl of the 1930s, this heat wave was considered the deadliest in US history. The entire eastern half of the country was affected, from St. Louis to New York City. Conditions in New York became so hot that the city's horses collapsed and died in massive numbers, with the lives of 250 horses being claimed within a few days. In the aftermath of the two month heat wave, nearly 10,000 people lost their lives. More Americans died during this heat wave than any other in the country's history.
 Photo: Don Graham / Flickr / CC-BY-SA 2.0
Date: Summer of 1988
Highest Temperature: Unknown
Deaths: 5,000 to 10,000
The 1988 North American drought was one of the worst weather disasters in North American history. The drought was prolonged and lasted throughout the summer of 1988 with unseasonably high temperatures breaking out in different places and at different times. This made it extremely difficult to figure out the exact origin of the high heat and low rainfall. Some theories attribute the drought to dense air in the upper atmosphere as well as early effects of climate change.
The drought was marked by weeks on end of temperatures reaching close to 100 degrees. It is unclear how many heat-related deaths could be attributed to the heat wave alone and not other factors, but thousands likely lost their lives due to excessive heat. In addition to the loss of life, power grids shut down frequently, causing outages.
 Photo: Chris Light / Wikimedia Commons / CC-BY-SA 3.0
Date: June - September, 1980
Highest Temperature: 108 °F
Deaths: At least, 1,700 but possibly up to 10,000 considering indirect deaths
Parts of the South and Midwest were hit with extremely high temperatures throughout the summer of 1980. This massive heat wave was one of the longest on record, and some estimates put the total death count as high as 10,000 people counting indirect deaths. In much of the country, temperatures did not dip below 90 degrees Fahrenheit for months on end. Roughly $20 billion in damages were recorded from agricultural sources affected by the ensuing drought, with livestock deaths also contributing to the financial burden. The heat wave came to an end with the arrival of Hurricane Allen.
 Photo: Ville Miettinen / Wikimedia Commons / CC-BY 2.0
Date: June 5, 2015
Highest Temperature: 118 °F
Deaths: 2,500
Due to the late coming of India's monsoon season, the country was hit by a severe heatwave that left thousands dead. Temperatures got so high that streets in Dehli began to melt, morphing the asphalt and affecting transportation. Indian health authorities urged the population to take extreme precautions during the wave, telling citizens to stay hydrated, wear light clothes, and carry umbrellas to protect from sunburns. The heat wave finally came to an end with the arrival of the first monsoon of the season.
 Photo: AliHayri93 / Wikimedia Commons / CC-BY-SA 4.0
Date: June 18 - June 24, 2015
Highest Temperature: 120 °F
Deaths: 2,000
A crippling heat wave smothered much of Pakistan during the height of Ramadan, an Islamic holy period where Muslims refrain from eating or drinking during daylight hours. The city of Karachi was particularly affected, with much of the death toll coming from there and the surrounding areas. The situation became so dangerous religious figures urged worshippers to break their fast if recommended by a doctor for their health. The massive death toll put a strain on the city's mortuaries, who were inundated with more corpses than they could process.
 Photo: Steven Collis / Flickr / CC-BY-NC-ND 2.0
Date: August, 1896
Highest Temperature: Unknown
Deaths: 1,500
The summer of 1896 was devastating for Americans living on the East Coast, especially those in New York City. During the middle of August, a devastating heatwave struck the city and persisted for 10 days. The heat wave caused thousands of deaths, many of them due to living in overcrowded, dirty tenements that worsened the effects of the high heat. Theodore Roosevelt was a police commissioner in the city at the time, and he wrote about the horrifying conditions he witnessed in the streets. Roosevelt helped provide aid during the disaster and ensured residents had access to commodities like ice.
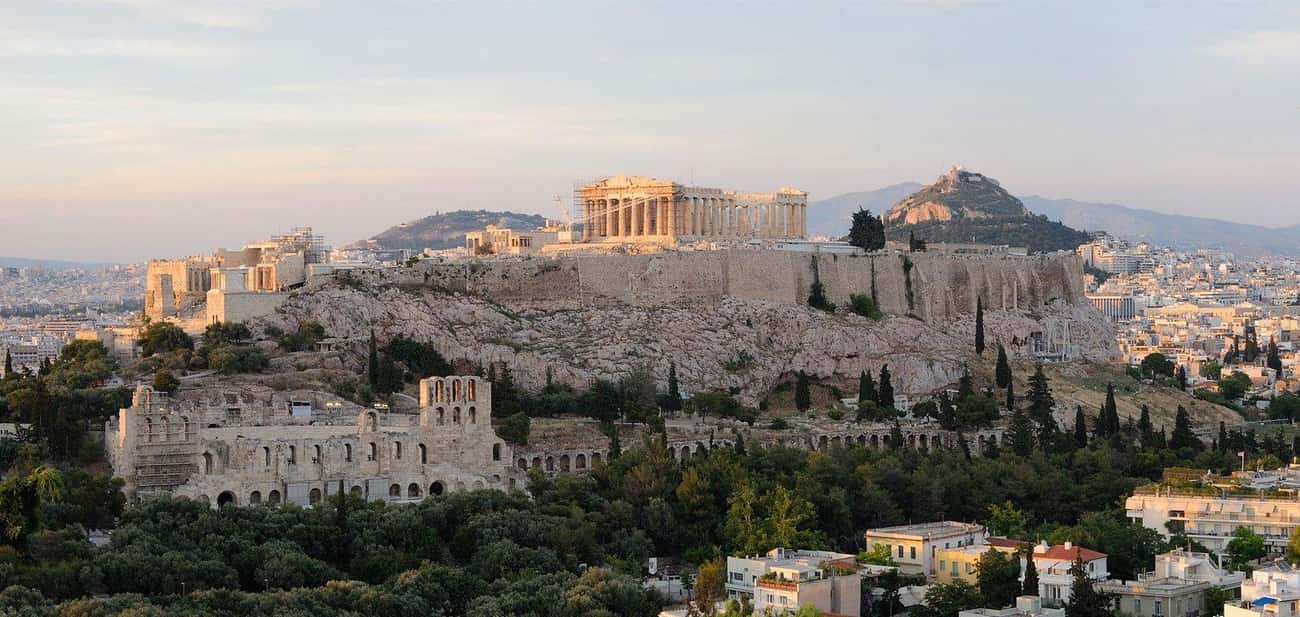 Photo: Christophe Meneboeuf / Wikimedia Commons / CC-BY-SA 3.0
Date: July - August 1987
Highest Temperature: 113 °F
Deaths: 1,300 - 1,500
Over a thousand Greeks lost their lives in the summer of 1987 after a prolonged heat wave scorched the region. It became so hot at times that gravediggers had to acquire ice from local fish markets in order to keep bodies from spoiling before they could be buried. Temperatures in Athens reached 113 degrees Fahrenheit, far above the average summer temperatures in the region. Lack of air conditioning in many Greek hospitals exasperated the death toll, and the elderly were hit particularly hard. The heat wave persisted for over a week before temperatures returned to normal levels.
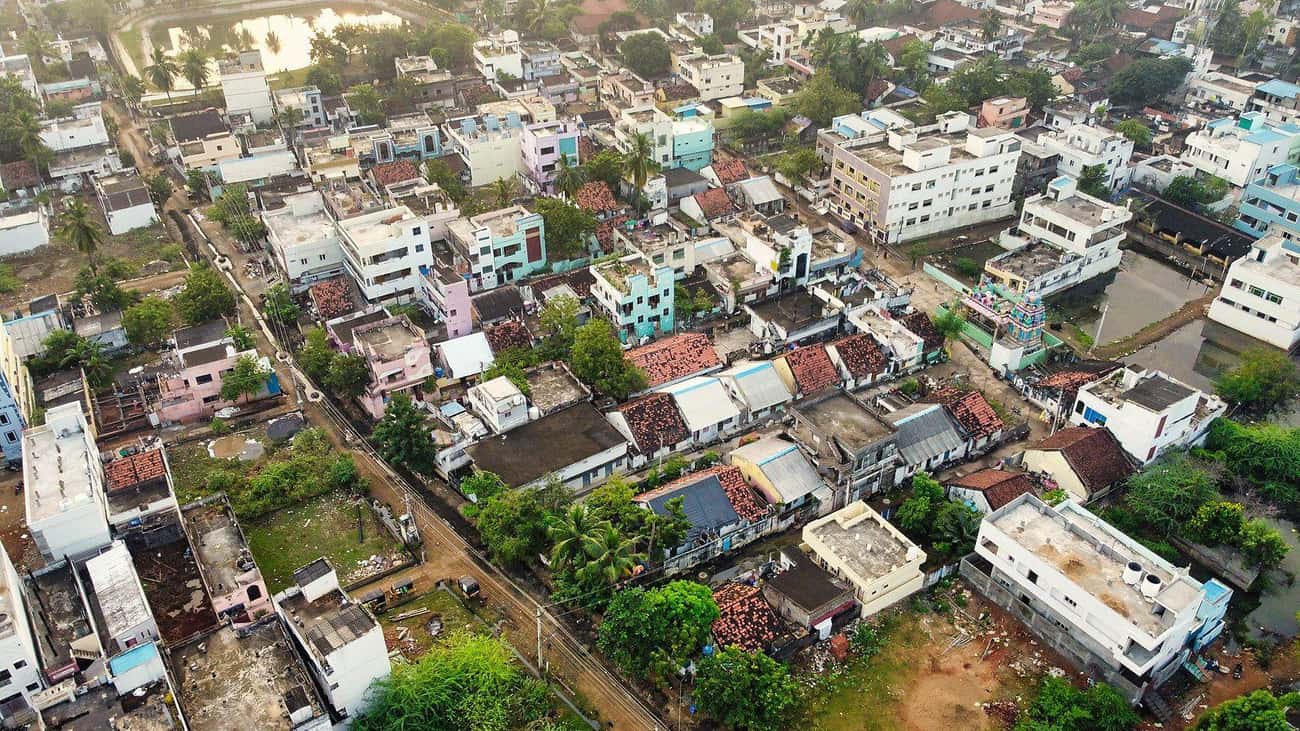 Photo: iMahesh / Wikimedia Commons / CC-BY-SA 4.0
Date: April - May, 2002
Highest Temperature: 111 °F
Deaths: 1,200
At least 1,200 deaths were confirmed during India's brutal 2002 heatwave, which lasted for over a month. The biggest impacts were in India's state of Andhra Pradesh, located in the southeast of the country. Over 1,000 victims lost their lives in just two weeks, making it one of the deadliest weeks in the country's history. Winds from India's dry northwest spread across the country, bringing with them exceptionally high temperatures.
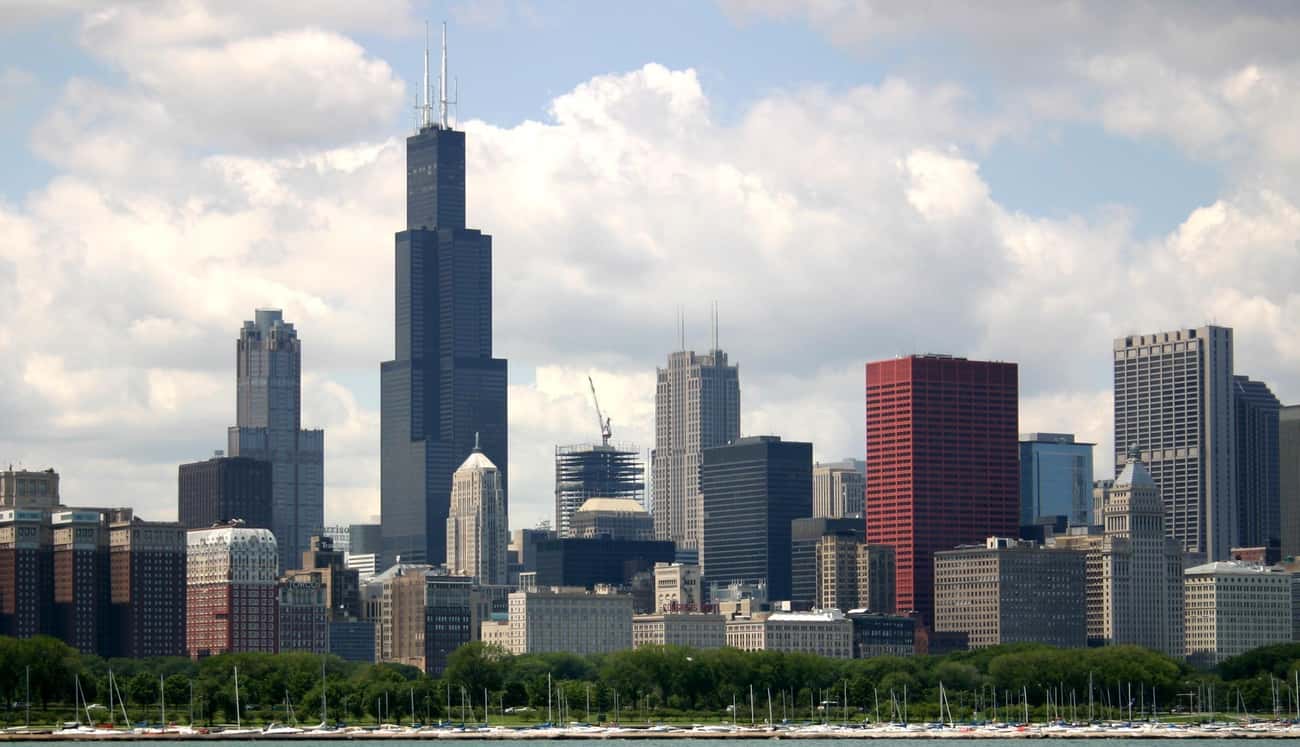 Photo: J. Crocker / Wikimedia Commons / Attribution
Date: July 1995
Highest Temperature: 106 °F
Deaths: 739
Approximately 215 people died on July 15, 1995, making it the worst day of Chicago's heat wave that year. Over 700 lost their lives by the end of the week. Temperatures remained above 90 degrees Fahrenheit for a full week, with several days seeing higher than 100 degree Fahrenheit weather. The high death toll was attributed to a multitude of factors that highlighted just how unprepared the city was for a disaster of this magnitude. Many people brushed off the threat of the heat, believing the severity of the situation to be overblown. The heat wave sparked a revolution in Chicago's disaster preparedness, with city officials hoping to prevent a similar tragedy from ever happening again.
2003 European Heat Wave
Date: July 20 - August 20, 2003
Highest Temperature: 104 °F
Deaths: 70,000+
The summer of 2003 was Europe's hottest since 1540, nearly 500 years ago. Tens of thousands succumbed to the heat across multiple nations due to scorching temperatures. France had a particularly high death toll, with estimates putting the dead at around 14,000. Daytime temperatures were punishing, and scarcely cooled even at night. One of the largest killers during the heat wave was stagnant air that accumulated pollutants and other toxins due to lack of circulation. Heat stroke and dehydration were also powerful killers, especially for older citizens.The heat wave cost the continent billions in lost crops and other damages. There is some disagreement as to why this particular heat wave was so devastating, but many experts lay the blame on global climate change.


.jpg)
No comments:
Post a Comment